Hi, what do you want to do?





Texas Instruments
Texas Instruments: Exploring the Golden Arches
Using given nutritional information of popular items from McDonald's, the students will develop and test a conjecture based on the given information. The students will analyze the two-variable data using the graphics calculator by...
Texas Instruments
Texas Instruments: This Is for the Birds!
This activity enables students to practice various skills such entering lists, comparing data, and utilizing statistical terms on the graphing calculator.
Texas Instruments
Texas Instruments: Graphing Your Motion With Easy Data App and Cbr 2
Students can use a CBR 2 motion detector to measure distance and velocity. Students prepare graphs of motion and analyze them. They compare and match graphs of distance versus time and velocity versus time.
Texas Instruments
Texas Instruments: Vernier a Speedy Slide With Easy Data App and Cbr 2
Students can use a CBR 2 motion detector to determine their speed or velocity going down a playground slide. They will also experiment with different ways to increase their speed going down the slide.
Texas Instruments
Texas Instruments: Bacterial Growth and Regression
This activity gives students a set of data to perform a regression analysis. Students need to be able to read the data, perform a regression, and interpolate and extrapolate information.

Texas Instruments
Texas Instruments: A Move in the Right Direction
Students physically provide motion data that is collected by a CBL and then graph the data. They determine if they "moved in the right directions" by comparing their graph with those printed in the activity.
Texas Instruments
Texas Instruments: Scatter Plots
Basic activity of collecting data and graphing sets of data to see if there is a relationship.
Texas Instruments
Texas Instruments: Step by Step Activity Data Collection & Analysis
In this activity, students create a situation that produces linear behavior by stepping heel to toe and taking distance readings as each step is taken. Students then apply the properties of a linear function to develop a model for motion.
Texas Instruments
Texas Instruments: Stretching Slinkies
This lesson provides students with the opportunity to explore the TI-84 graphing calculator in conjunction with Microsoft Excel. Students can use the "Stretching Slinkies" worksheet to record and enter data. They will either: enter data...
Texas Instruments
Texas Instruments: Ball Bounce
This activity allows students to use real data obtained by them to model quadratic equations. students can use the TI-83 and/or TI-84 and a motion detector to collect their data. The students will then manually fit both quadratic and...
Texas Instruments
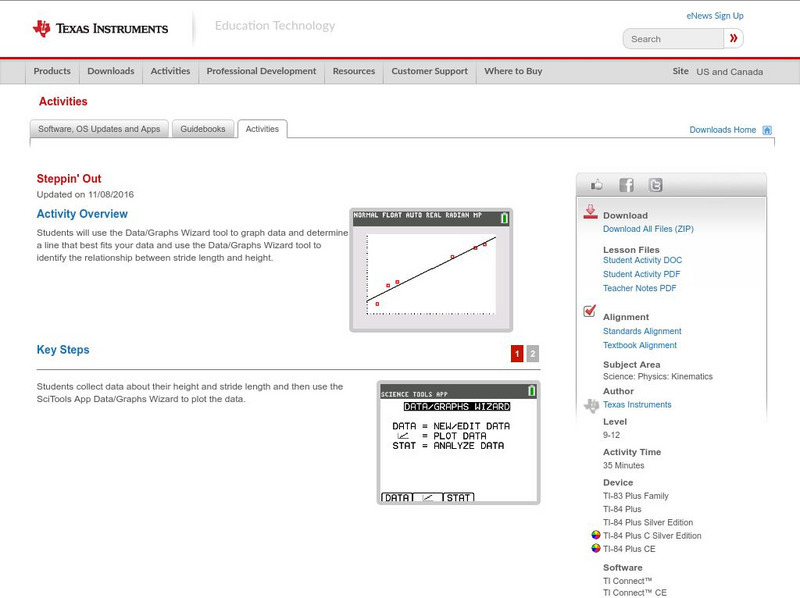
Texas Instruments: Steppin' Out
In this activity you will: Use the Data/Graphs Wizard tool to graph data and determine a line that best fits your data. Use the Data/Graphs Wizard tool to identify the relationship between stride length and height.
Texas Instruments
Texas Instruments: Predicting White Blood Counts
Students find equations, which best-fit the data, using different regression models built into their calculators. The best method of handling this data, is to break the data into sections and fit different periods of time with different...
Texas Instruments
Texas Instruments: Boat Registration and Manatee Deaths in Florida
Students will explore the data on boat registrations and manatee deaths in Florida. They will use the data, the graph of the data and the line of best fit to make predictions about the relationship of the data.
Texas Instruments
Texas Instruments: Eating Out
In this activity, students examine data and make graphs to represent the data. They interpret the data and answer questions. They also learn to calculate percentages and angle measures.
Texas Instruments
Texas Instruments: Math Today: Red Meat Consumption Continues to Drop
The USA TODAY Snapshot, "Red meat consumption continues to drop," will allow students to work with two sets of data over the same time period. This activity will show how a system of equations can be used to answer questions about the...
Texas Instruments
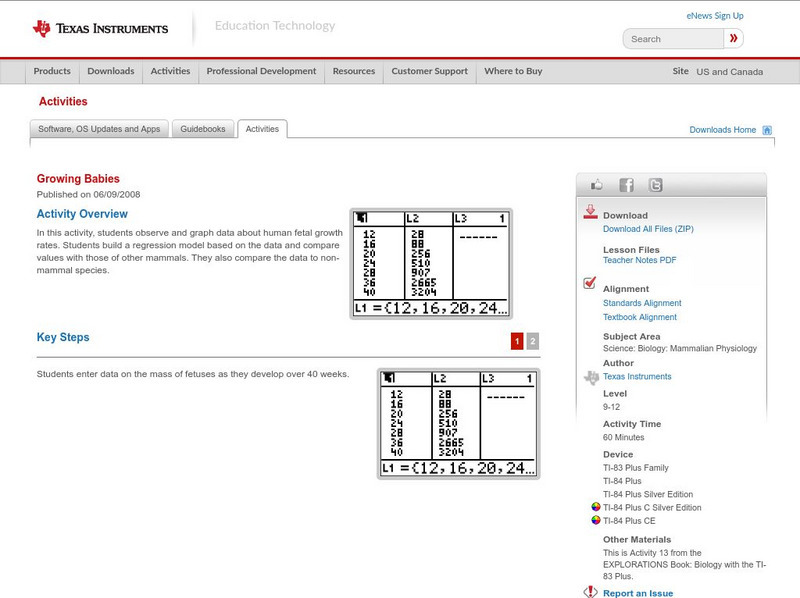
Texas Instruments: Growing Babies
In this activity, students observe and graph data about human fetal growth rates. Students build a regression model based on the data and compare values with those of other mammals. They also compare the data to non-mammal species.
Texas Instruments
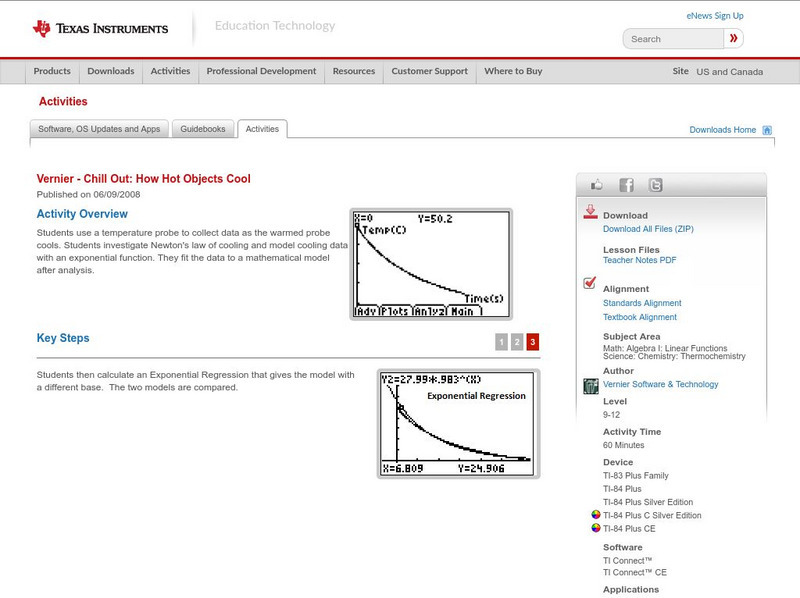
Texas Instruments: Chill Out: How Hot Objects Cool
Students use a temperature probe to collect data as the warmed probe cools. Students investigate Newton's law of cooling and model cooling data with an exponential function. They fit the data to a mathematical model after analysis.
Texas Instruments
Texas Instruments: How Far to Your Birthplace
Examine one-variable data analysis through the creation and exploration of a birth place data set. Graphing calculators are used to analyze the data through mean, median, mode, maximum, minimum, stem-and-leaf plots and box-and-whisker...
Texas Instruments
Texas Instruments: Up and Down: Damped Harmonic Motion
In this activity, students' will use a motion detector to record the motion data for a plate bouncing at the end of a light spring, and analyze the data to determine frequency, period and amplitude. They will then find an appropriate...
Texas Instruments
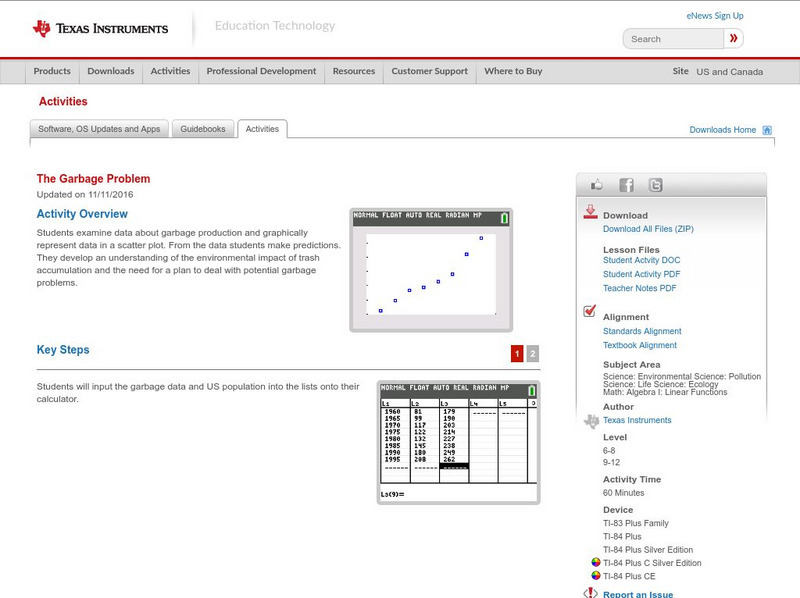
Texas Instruments: The Garbage Problem
Students examine data about garbage production and graphically represent data in a scatter plot. From the data students make predictions. They develop an understanding of the environmental impact of trash accumulation and the need for a...
Texas Instruments
Texas Instruments: Chill Out: How Hot Objects Cool
In this activity, students can use a temperature probe to collect data as the warmed probe cool. Students will investigate Newton's law of cooling and model cooling data with an exponential function. They will fit the data to a...
Texas Instruments
Texas Instruments: Numb3 Rs: "Take Out" Outliers
Based off of the hit television show NUMB3RS, this lesson has students create box-and-whisker plots for given data, and then determine which (if any) data points are outliers. Students determine outliers through two methods in this...
Texas Instruments
Texas Instruments: Math Today Super Ticket Sales
Students will create two box and whisker plots of the data in the USA TODAY Snapshot. They will calculate central tendencies for both sets of data and compare the two sets of data by analyzing the differences in the box and whisker plots.
Texas Instruments
Texas Instruments: An Exploration of Direct Variation and Linear Regression
Students will use this activity for the following Algebra concepts: Review of Direct Variation; Properties of direct variations; Finding the constant of variations from data sets; Find missing values in data sets both numerically and...