Hi, what do you want to do?





Texas Instruments
Texas Instruments: Exploring the Pythagorean Theorem and Its Applications
Students discover the Pythagorean Theorem by exploring right triangles using Cabri Jr. They apply the Pythagorean Theorem to real-world problems. Also, students create a scatter plot of the data and find an equation that fits the data.
Texas Instruments
Texas Instruments: Assumptions and Conditions for Significance/hypoth
These questions cover the criteria for inference tests: "conditions," when the actual data is given, and "assumptions," when the data is missing and only summary statistics are given.
Texas Instruments
Texas Instruments: Crawling Around: Parametric Plots
In this activity, students' will record the x- and y-coordinates of a rod moving in a figure-eight pattern. They will then use the recorded motion information to separately model the x- and y-motion as a function of time. They will plot...
Texas Instruments
Texas Instruments: Linear Relationship Between Weight and Quality
Students use a Force Sensor to collect weight versus number data for a collection of identical pennies and model the data using a linear equation. They will then interpret the slope as it relates to independent and dependent variables.
Texas Instruments
Texas Instruments: Let's Play Ball With Families of Graphs
This activity is designed for students to use real-time data to generate a family of parabolic graphs. The data set will be generated by graphing the heights of a ball bounce with respect to time. Students will determine the regression...
Texas Instruments
Texas Instruments: Logistic Growth
Students are introduced to logistic growth curves using a graphing calculator. Lab data includes the number of bacteria over a 20-hour period. The activity numerically approximates the derivative and uses regression to find a curve...
Texas Instruments
Texas Instruments: Making Picture Graphs
Students learn to make picture graphs with symbols that represent more than one piece of data.
Texas Instruments
Texas Instruments: Line of Best Fit
In this activity, students learn to collect data and plot the data. They use the manual-fit feature to form a line of best fit.
Texas Instruments
Texas Instruments: A Wet Welcome Home Adventure 4
Students perform an experiment that simulates a leaking pipe and gather data on volume of water lost over time. They graph the data collected as a scatter plot, find the equation of the line of best fit, find the total volume of water...
Texas Instruments
Texas Instruments: M&m's and Decay Graphs
Observe exponential decay with the classic M&M lab, here written up and ready to go. At the end, the author intends for students to send equations and data to the teacher via TI-Navigator, but this step can done on paper if the...
Texas Instruments
Texas Instruments: Confidence Intervals
Learn to use the TI-89 to construct confidence intervals either using data or using sample statistics. The activity has step-by-step calculator instructions along with calculator screen prints.

Texas Instruments
Texas Instruments: Approximation of Pi Using Statistical Testing
Students can use a Monte Carlo method to collect data. This data, along with an area model of pi, will be used to approximate pi.
Texas Instruments
Texas Instruments: Measures of Central Tendency Activity: Height of the Class
The purpose of this lesson is to have students create a box and whiskers plot from collecting class data of each person's height.
Texas Instruments
Texas Instruments: Creating Charts
Students learn to represent data in a list as a bar chart. They examine statistics from the 2000 Olympic Games and determine the team that took home the most medals.
Texas Instruments
Texas Instruments: The Effect of Temperature on the Rate of Dissolving
In this activity, students will use a Temperature Sensor to collect data and then analyze that data to determine the effect of temperature increases on the rate of dissolving. They will identify temperature as a factor in dissolving rate...
Texas Instruments
Texas Instruments: A Steep Hike Adventure 3
Students use the CBR 2 to gather distance and time data for various walking speeds. They observe the effect of change in direction and speed of motion on distance versus time graphs. Students interpret and analyze graphs, calculate slope...
Texas Instruments
Texas Instruments: Reaction Time
The students will do experiments involving reaction time, and then make a histogram displaying their data.
Texas Instruments
Texas Instruments: Exploring Circles
Explore the relationship between the center and radius of a circle and the equation of the circle. Collect data and determine regression equations related to various combinations of data, and use the regression equations to make...

Texas Instruments
Texas Instruments: Variety Is the Spice of Life
In this activity, students will collect data on all members of the class. They will make a graph of the data collected, interpret variations, and then draw conclusions.
Texas Instruments
Texas Instruments: Women's 5000 M World Record Progression: Median Median Line
In this activity, students will collect the Women's 5000 meter progression of world record data and find the median - median line and the linear regression for the data. They will investigate the appropriateness of each of the models.
Texas Instruments
Texas Instruments: Glencoe Middle School Science: Biodiversity and Ecosystems
Students will conduct a field investigation to learn about the environment. They will observe biotic and abiotic factors of an ecosystem. Students can use the CBL 2 and a temperature probe to collect data and a graphing calculator to...
Texas Instruments
Texas Instruments: Discovering Ohm's Law
In this activity, students use voltage and current probes to investigate Ohm's Law. The students collect data and use their graphing calculators to perform data analysis and "discover" Ohm's Law.

Texas Instruments
Texas Instruments: Jason: Health of Aquatic Life a Real Problem
JASON Aquatic Field Study: Use water temperature, turbidity, and dissolved oxygen data collected by researchers to examine the quality of an aquatic site using a TI-73 Explorer to graph and analyze the values and determine its water...
Texas Instruments
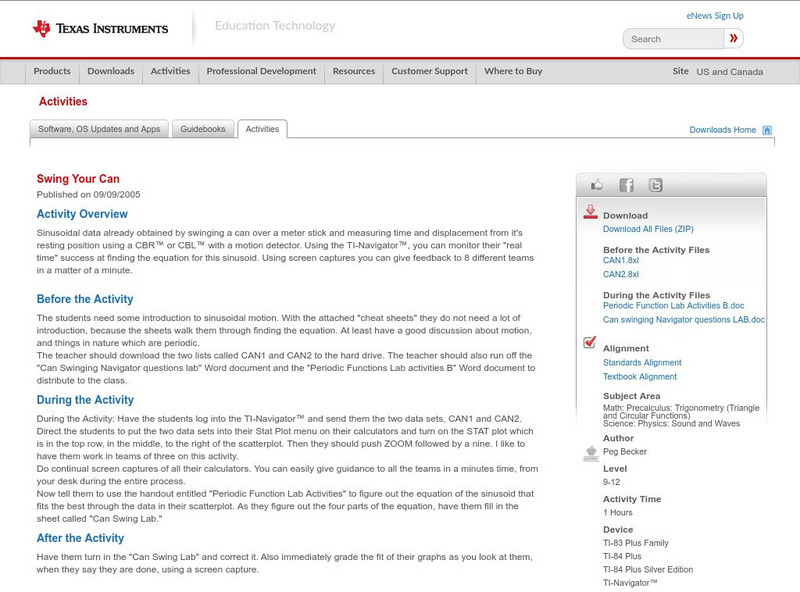
Texas Instruments: Swing Your Can
Sinusoidal data already obtained by swinging a can over a meter stick and measuring time and displacement from its resting position using a CBR or CBL with a motion detector. Using the TI-Navigator, you can monitor their "real time"...