Hi, what do you want to do?





Texas Instruments
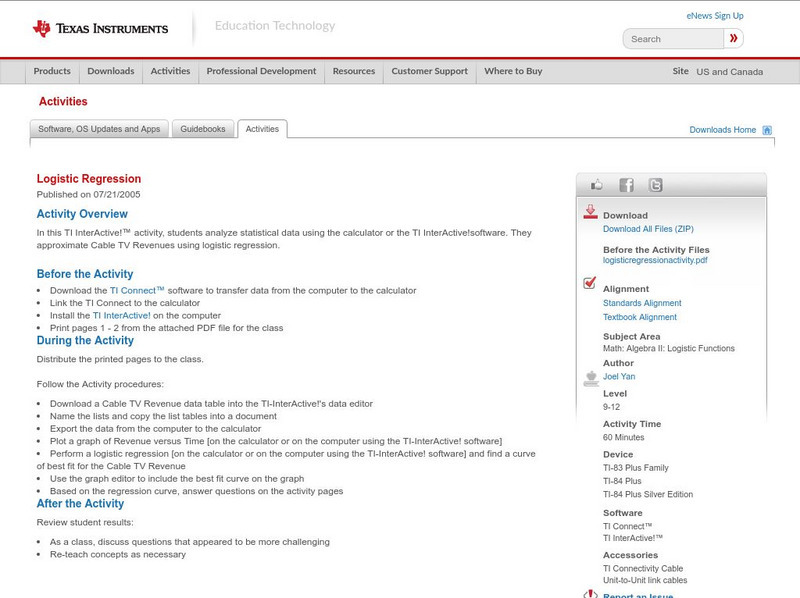
Texas Instruments: Logistic Regression
In this TI InterActive! activity, students analyze statistical data using the calculator or the TI InterActive!software. They approximate Cable TV Revenues using logistic regression.

Texas Instruments
Texas Instruments: How Strong Is Your Bridge?
Build a bridge of straw and straight pins. Data is collected and analyzed with handhelds by the students measuring the height of the bridge vs the number of marbles (in a cup.)
Texas Instruments
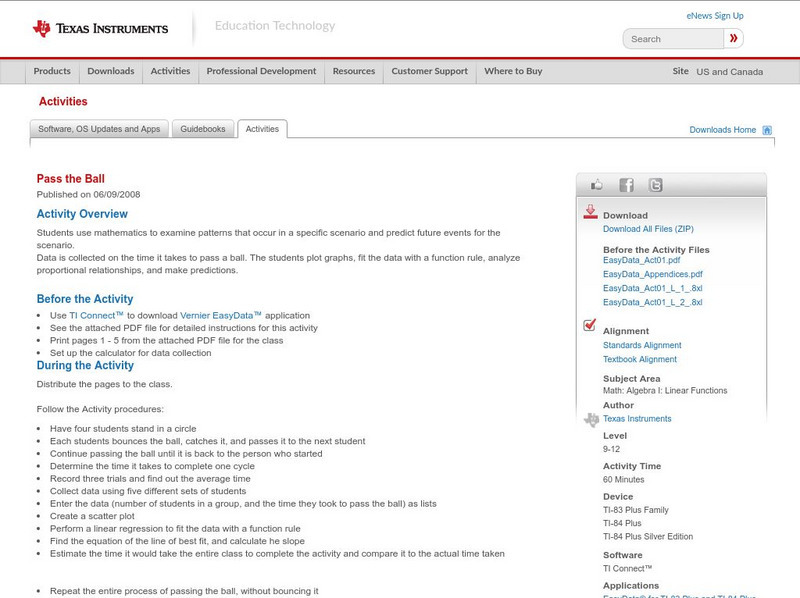
Texas Instruments: Pass the Ball
In this activity, students use mathematics to examine patterns that occur in a specific scenario and predict future events for the scenario. Data is collected on the time it takes to pass a ball. The students plot graphs, fit the data...
Texas Instruments
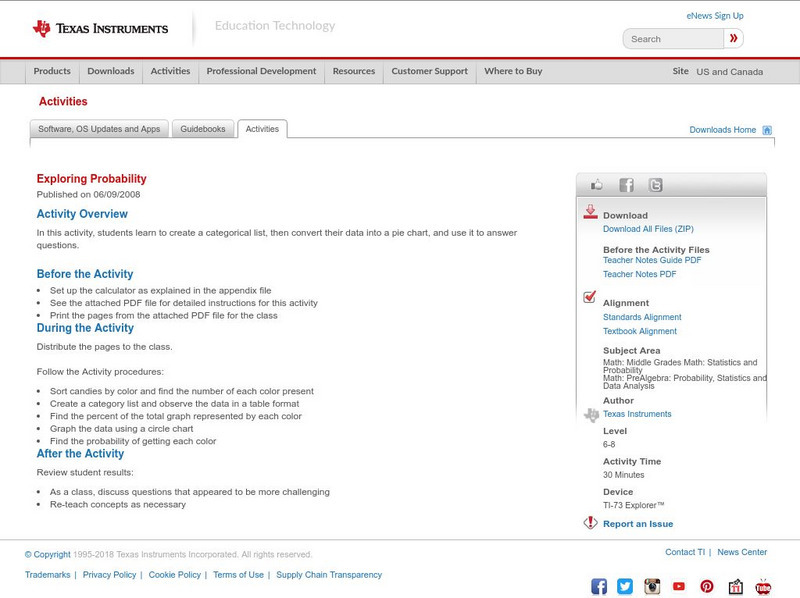
Texas Instruments: Exploring Probability
In this activity, students learn to create a categorical list, then convert their data into a pie chart, and use it to answer questions.

Texas Instruments
Texas Instruments: Solving a System of Linear Equations
In this activity, students' will collect and analyze motion data in order to determine the solution to a linear system of equations. They graph two motions on a common axis and find their intersection.

Texas Instruments
Texas Instruments: Making Conjectures and Planning Studies
This activity introduces students to the concept of collecting and analyzing data and using conjectures to formulate new questions.

Texas Instruments
Texas Instruments: Gemini Candy
In this activity, students work in groups to collect data and draw conclusions from random samples simulated by drawing tiles from a bag. They represent the data collected in the form of a triple bar graph.
Texas Instruments
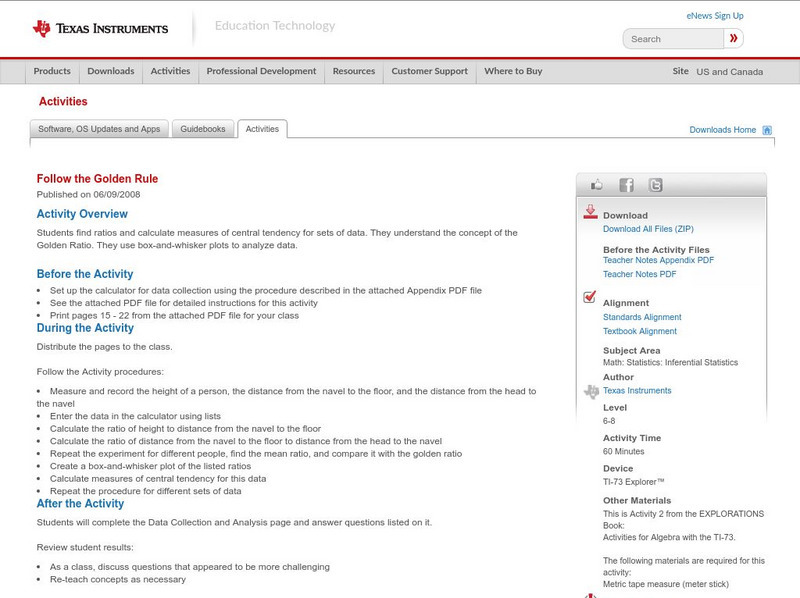
Texas Instruments: Follow the Golden Rule
Students find ratios and calculate measures of central tendency for sets of data. They understand the concept of the Golden Ratio. They use box-and-whisker plots to analyze data.
Texas Instruments
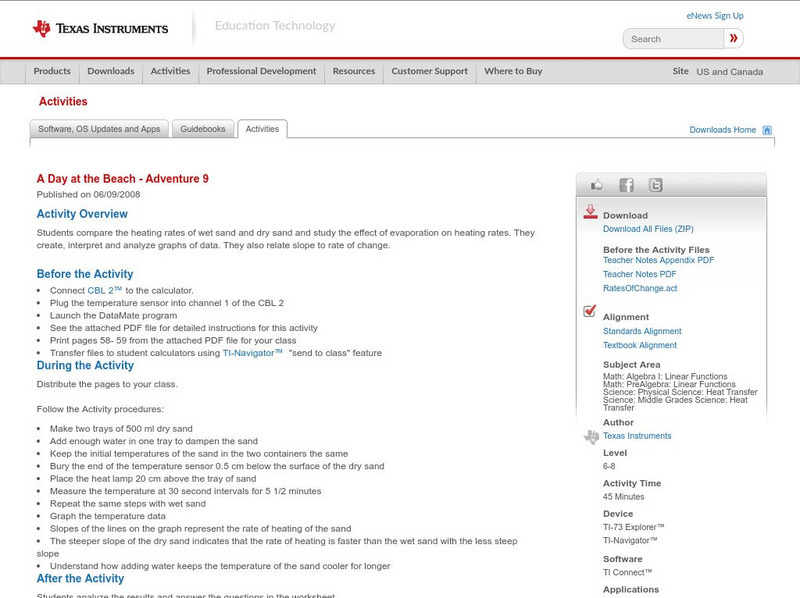
Texas Instruments: A Day at the Beach Adventure 9
Students compare the heating rates of wet sand and dry sand and study the effect of evaporation on heating rates. They create, interpret and analyze graphs of data. They also relate slope to rate of change.
Texas Instruments
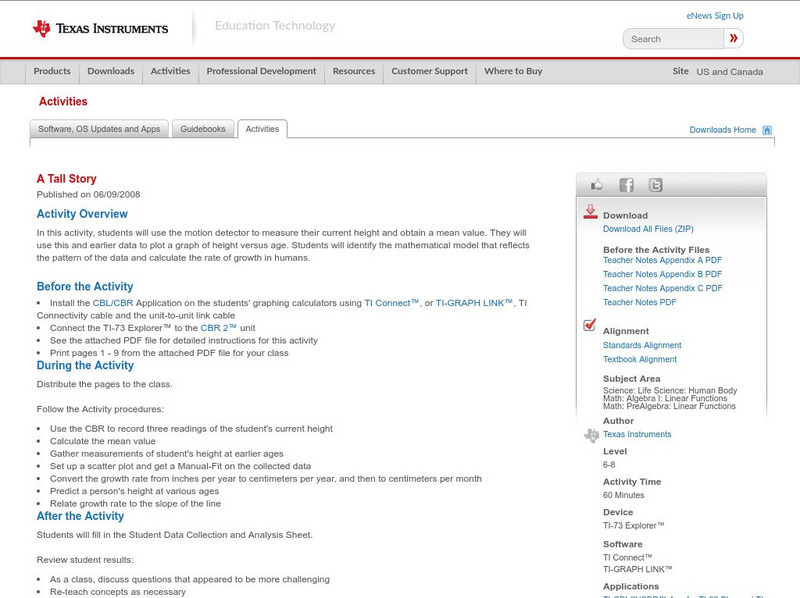
Texas Instruments: A Tall Story
In this activity, students can use the motion detector to measure their current height and obtain a mean value. They will use this and earlier data to plot a graph of height versus age. Students will identify the mathematical model that...
Texas Instruments
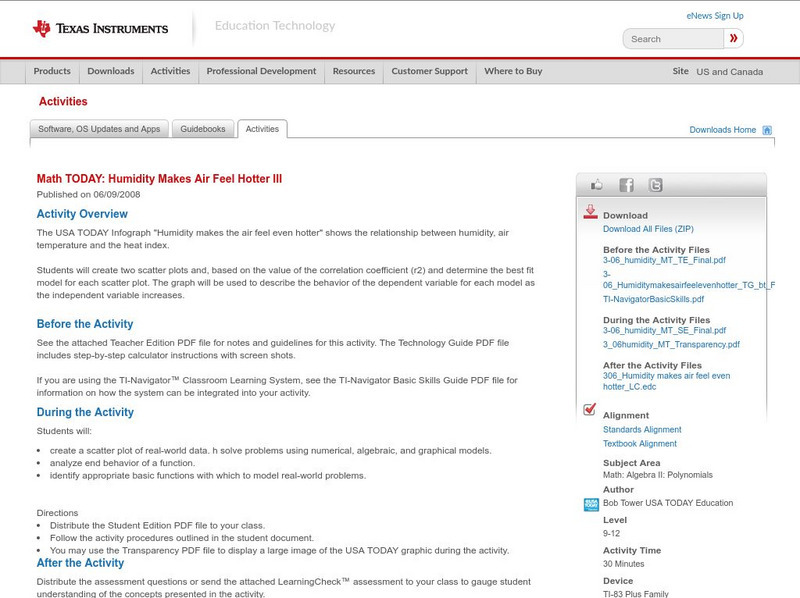
Texas Instruments: Math Today: Humidity Makes Air Feel Hotter Iii
Investigate the relationship among humidity, air temperature, and the heat index while learning about modeling data, evaluating functions, and describing the end behavior of a function. Students will use graphing calculator technology to...
Texas Instruments
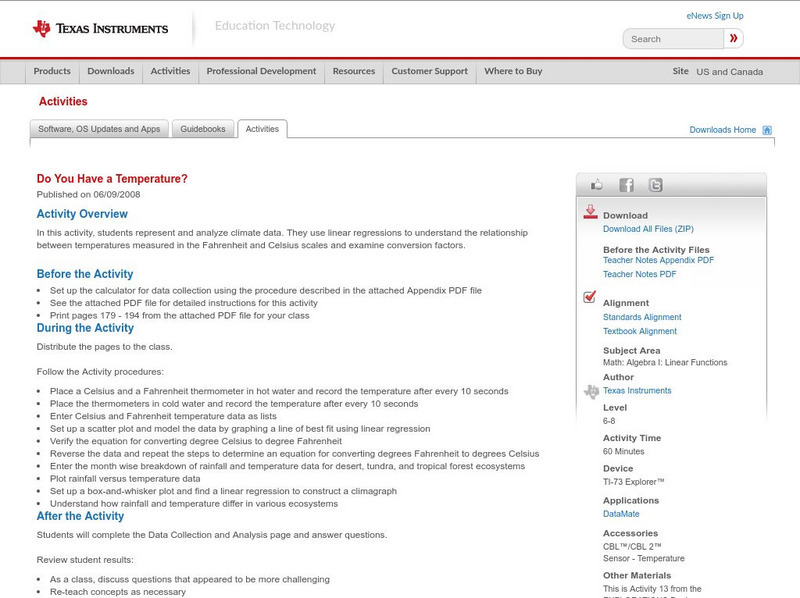
Texas Instruments: Do You Have a Temperature?
In this activity, students represent and analyze climate data. They use linear regressions to understand the relationship between temperatures measured in the Fahrenheit and Celsius scales and examine conversion factors.
Texas Instruments
Texas Instruments: Bounce Back: The Exponential Pattern of Rebound Heights
In this activity, students' will use a motion detector to collect motion data for a bouncing ball. They will then analyze the data to test the exponential model of motion.
Texas Instruments
Texas Instruments: Ball Toss Activity
Students receive data from tossing a ball into the air. They are to graph it, set a window, and analyze the height, how long it was in the air, etc. They then find an equation that models the data.
Texas Instruments
Texas Instruments: On the Rebound
In this activity, students collect motion data for a bouncing ball using a motion detector. They analyze the data and attempt to find the exponential relationship between the bounce number and maximum height that the bounce reaches.
Texas Instruments
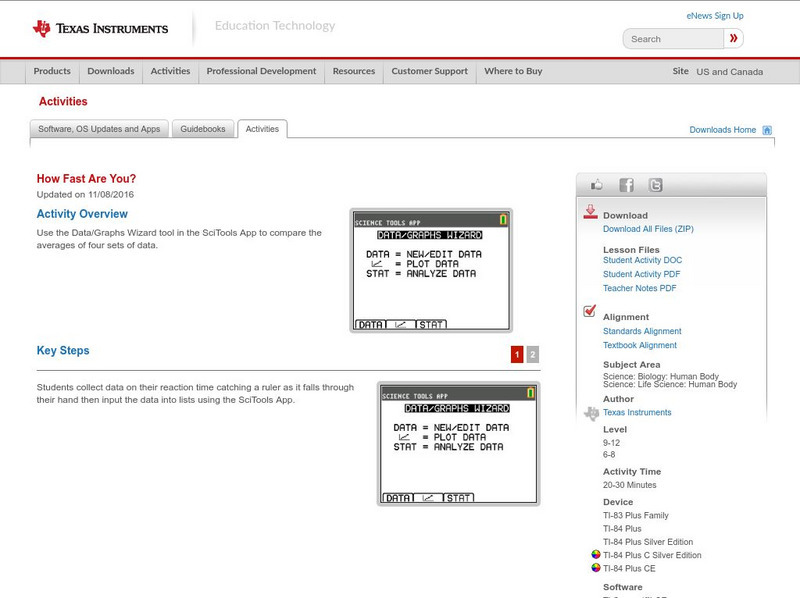
Texas Instruments: How Fast Are You?
Use the Data/Graphs Wizard tool in the SciTools App to compare the averages of four sets of data.
Texas Instruments
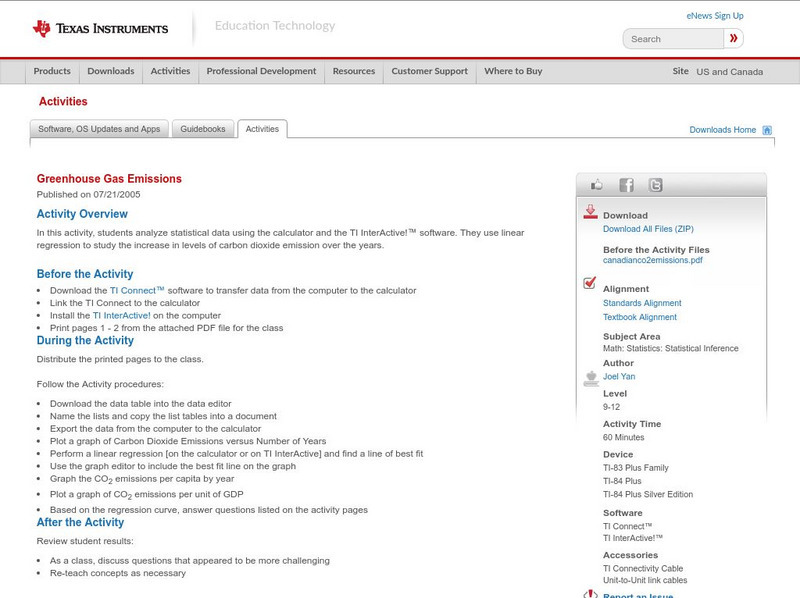
Texas Instruments: Greenhouse Gas Emissions
In this activity, students analyze statistical data using the calculator and the TI InterActive! software. They use linear regression to study the increase in levels of carbon dioxide emission over the years.
Texas Instruments
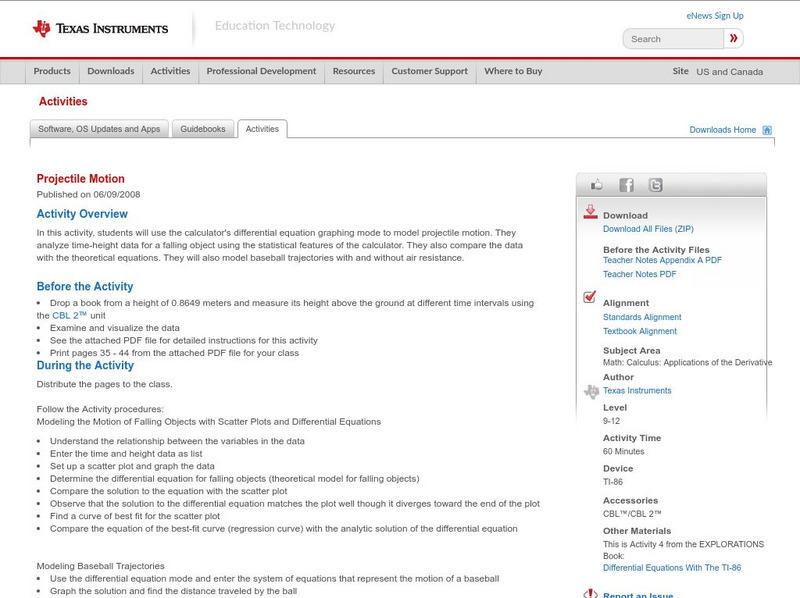
Texas Instruments: Projectile Motion
In this activity, students can use the calculator's differential equation graphing mode to model projectile motion. They analyze time-height data for a falling object using the statistical features of the calculator. They also compare...
Texas Instruments
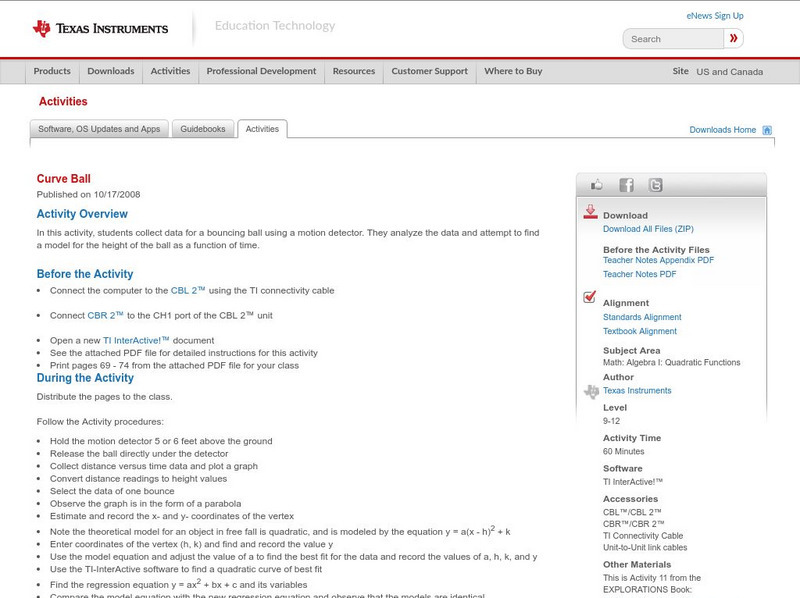
Texas Instruments: Curve Ball
In this activity, students collect data for a bouncing ball using a motion detector. They analyze the data and attempt to find a model for the height of the ball as a function of time.

Texas Instruments
Texas Instruments: Math Today Challenge New Color of Money
In this activity, students will read about the changes in the "new money" and then create a graph to represent various combinations of currency produced. This activity provides an excellent example of discrete, real-world data.

Texas Instruments
Texas Instruments: Biggest Box
A classic problem looking at maximizing volume by varying the height of a box. Uses graphing calculators to analyze data collected and to model a cubic equation. Look for points that maximize volume while developing a preliminary notion...
Texas Instruments
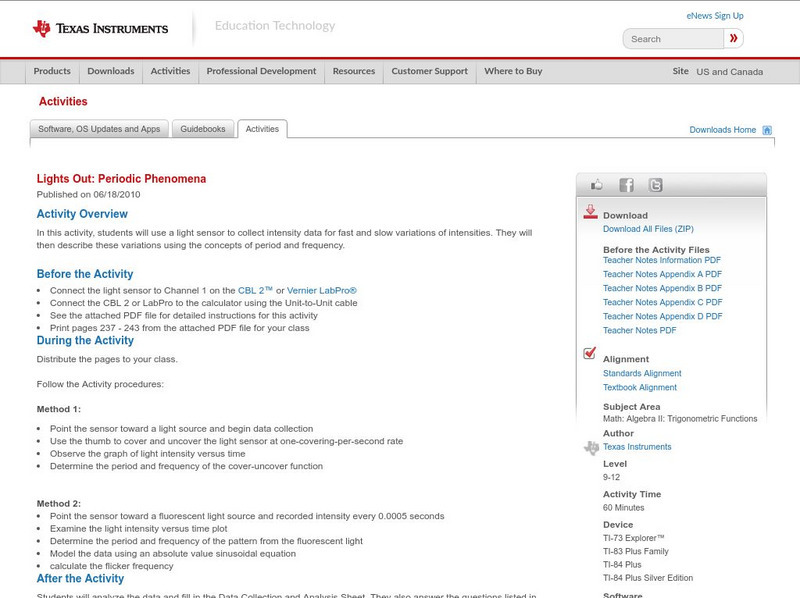
Texas Instruments: Lights Out: Periodic Phenomena
In this activity, students can use a light sensor to collect intensity data for fast and slow variations of intensities. They will then describe these variations using the concepts of period and frequency.
Texas Instruments
Texas Instruments: Light at a Distance: Distance and Light Intensity
In this activity, students can use a light sensor to record the light intensity at various distances from a bulb. They will compare the data to an inverse square and a power law model.
Texas Instruments
Texas Instruments: Finding the Maximum Product
In this activity, students use the CellSheet Application to organize data. They solve a problem of finding two positive integers equal to or greater than zero with a given sum and the maximum product.