Hi, what do you want to do?





Texas Instruments
Texas Instruments: Getting Started With Probability Simulations App
Explore probability theory with interactive animation that simulates the rolling of dice, tossing of coins and generating random numbers. Evaluation options include bar graphs, table of trials data, settings for specifying the number of...
Texas Instruments
Texas Instruments: Statistics Pretest
This is a pre-test for a statistics class. Since most systems want data driven analysis, this is a great way to get data at the beginning of the course on how much students know about statistics.
Texas Instruments
Texas Instruments: Math Today World Population in 2050
The data in the USA TODAY Snapshot "World Population in 2050" is in a relative frequency form. students can use the percents to calculate the population for each of the continents shown and then display this data as a bar graph.
Texas Instruments
Texas Instruments: Numb3 Rs: Exponential Modeling
Based off of the hit television show NUMB3RS, this lesson introduces students to exponential equations, their graphs, and their application in the real world. The lesson is framed in the context of the number of cell phone users for a...
Texas Instruments
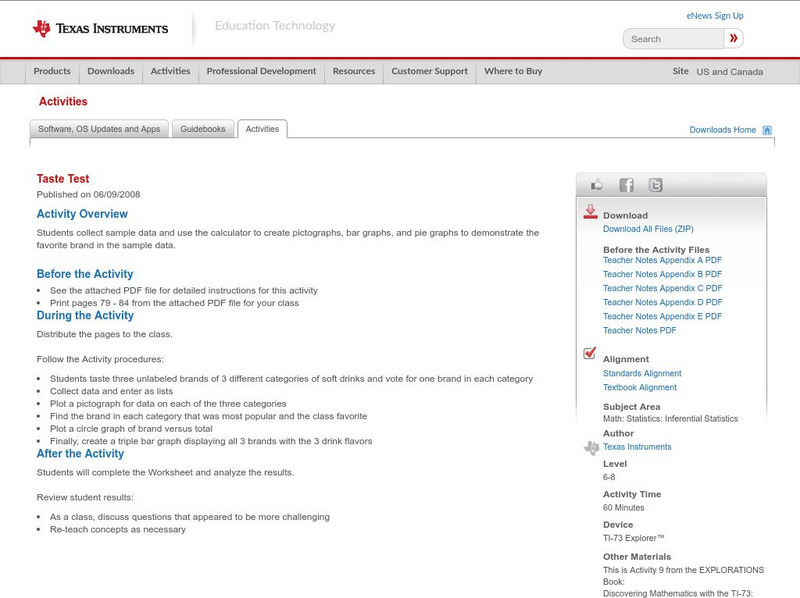
Texas Instruments: Taste Test
Students collect sample data and use the calculator to create pictographs, bar graphs, and pie graphs to demonstrate the favorite brand in the sample data.
Texas Instruments
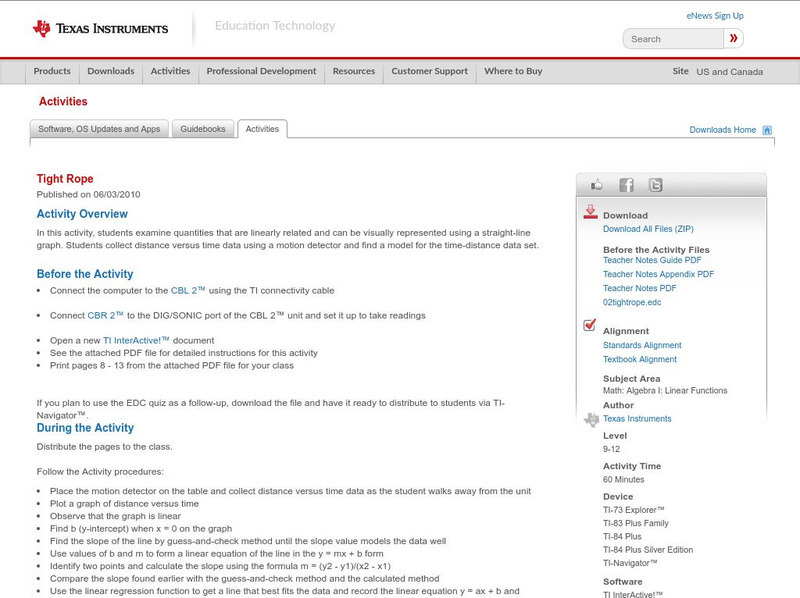
Texas Instruments: Tight Rope
In this activity, students examine quantities that are linearly related and can be visually represented using a straight-line graph. Students collect distance versus time data using a motion detector and find a model for the...

Texas Instruments
Texas Instruments: Stepping to the Greatest Integer: Greatest Integer Function
In this activity, students' will use a motion detector to collect position data showing evenly-spaced jumps in value. They will then model this data using the greatest integer function.
Texas Instruments
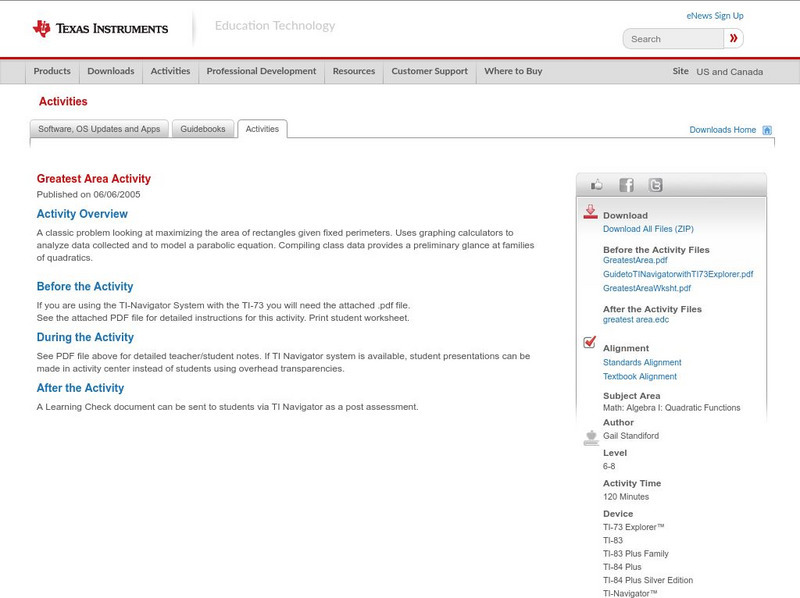
Texas Instruments: Greatest Area Activity
A classic problem looking at maximizing the area of rectangles given fixed perimeters. Uses graphing calculators to analyze data collected and to model a parabolic equation. Compiling class data provides a preliminary glance at families...
Texas Instruments
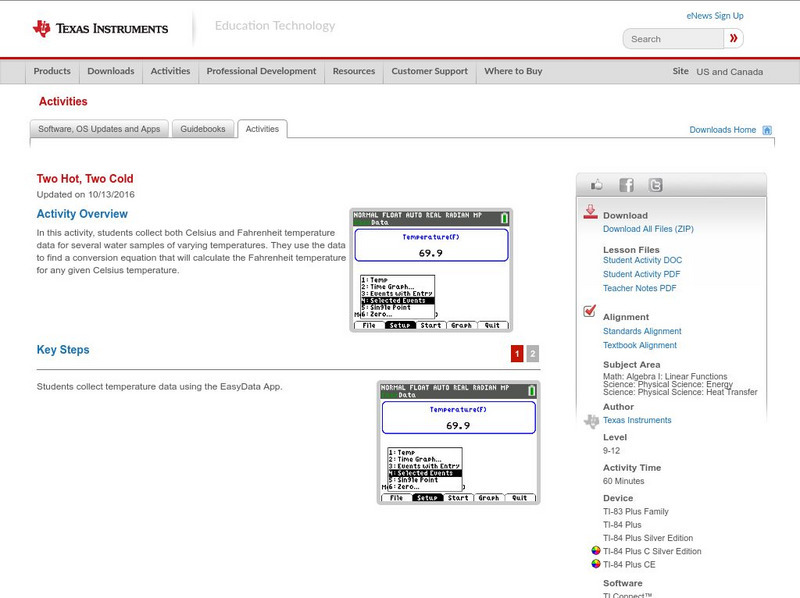
Texas Instruments: Two Hot, Two Cold
In this activity, students collect both Celsius and Fahrenheit temperature data for several water samples of varying temperatures. They use the data to find a conversion equation that will calculate the Fahrenheit temperature for any...
Texas Instruments
Texas Instruments: Numb3 Rs: Magnetism
Based off of the hit television show NUMB3RS, this lesson, designed for upper-level high school students, has students linearize the data describing the force of a magnet at various distances. While it is assumed students already know...
Texas Instruments
Texas Instruments: Modeling Exponential Decay With a Look at Asymptotes
Students use sample data to approximate models with the Transformation Graphing Application. They are introduced to the idea of discrete data sets being used with continuous function models. They also identify non-zero asymptote form of...
Texas Instruments
Texas Instruments: Is There a Limit?
In this activity, students examine data about bacteria and their growth. They produce a scatter plot, a best-fit model, and draw conclusions based on the data and graph.
Texas Instruments
Texas Instruments: Measures of Central Tendency
Mean, median, and mode are measures of central tendency in data analysis. Each can be used to identify central tendency. Box-and-whiskers plots are a visual representation of collected data involving medians.
Texas Instruments
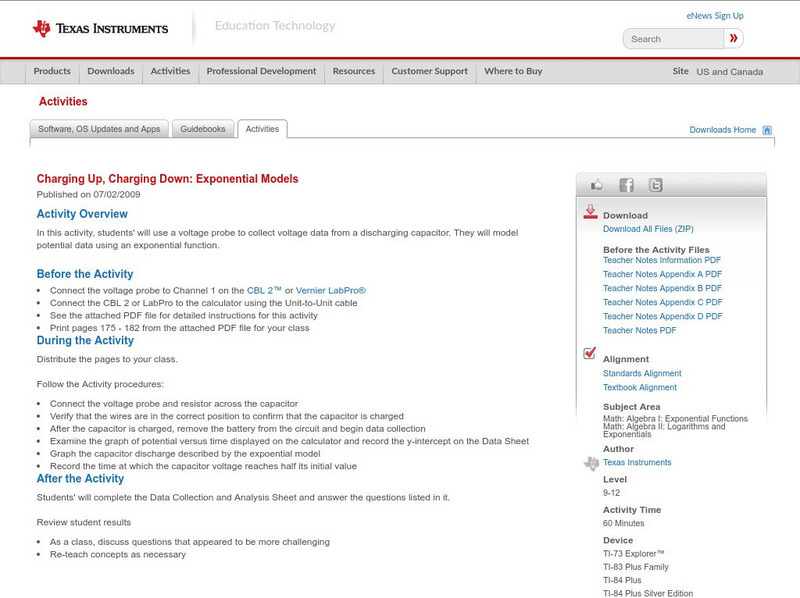
Texas Instruments: Charging Up, Charging Down: Exponential Models
In this activity, students' will use a voltage probe to collect voltage data from a discharging capacitor. They will model potential data using an exponential function.
Texas Instruments
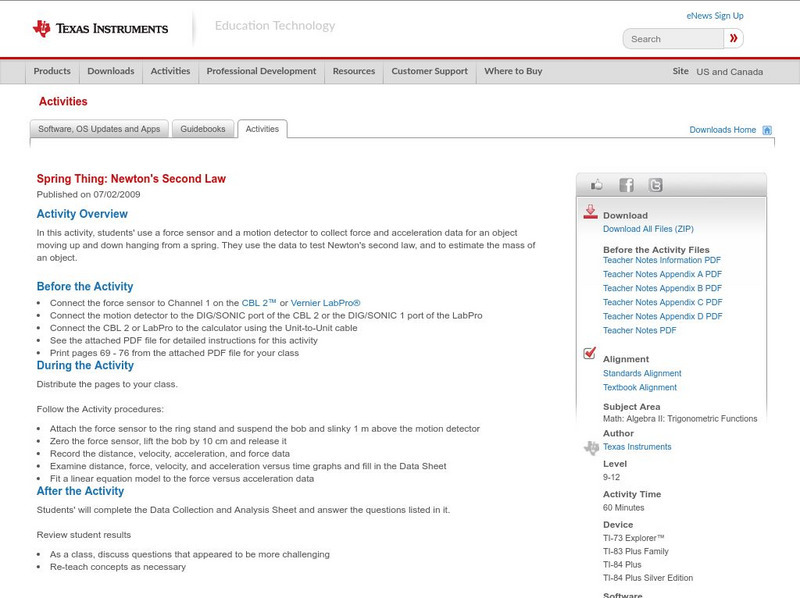
Texas Instruments: Spring Thing: Newton's Second Law
In this activity, students' use a force sensor and a motion detector to collect force and acceleration data for an object moving up and down hanging from a spring. They use the data to test Newton's second law, and to estimate the mass...
Texas Instruments
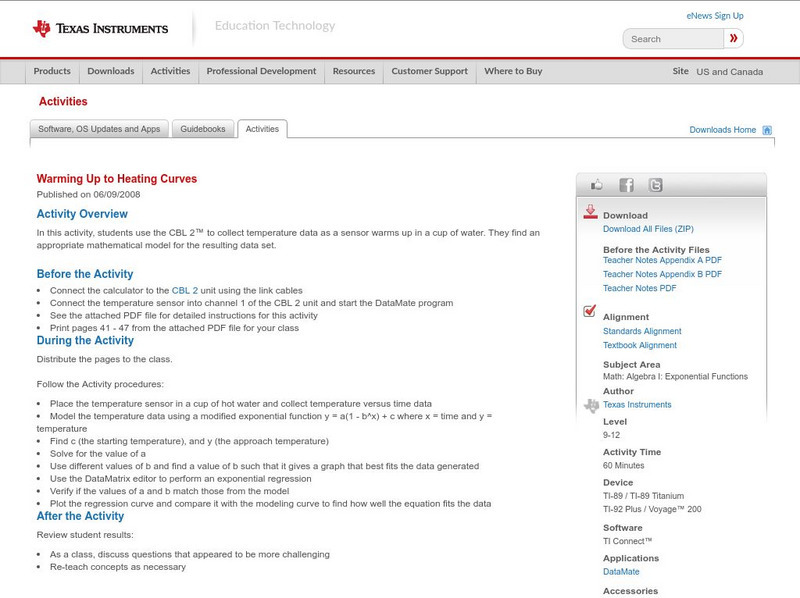
Texas Instruments: Warming Up to Heating Curves
In this activity, students use the CBL 2 to collect temperature data as a sensor warms up in a cup of water. They find an appropriate mathematical model for the resulting data set.
Texas Instruments
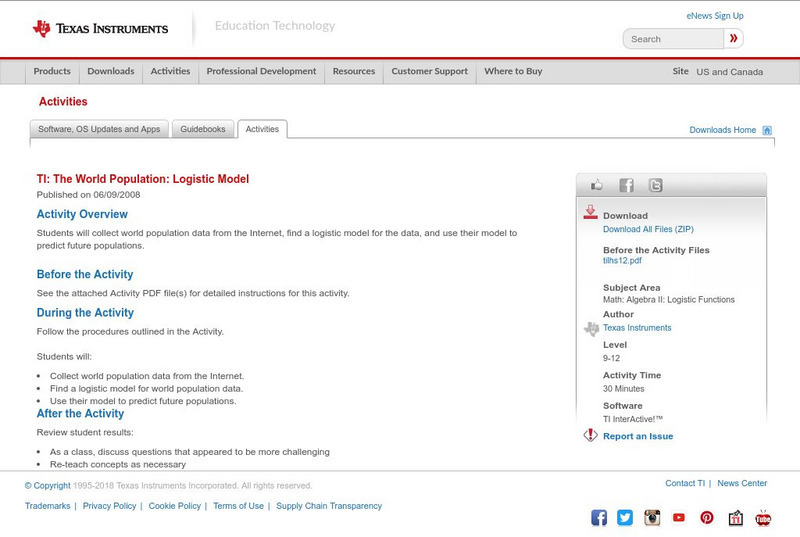
Texas Instruments: The World Population: Logistic Model
Students will collect world population data from the Internet, find a logistic model for the data, and use their model to predict future populations.
Texas Instruments
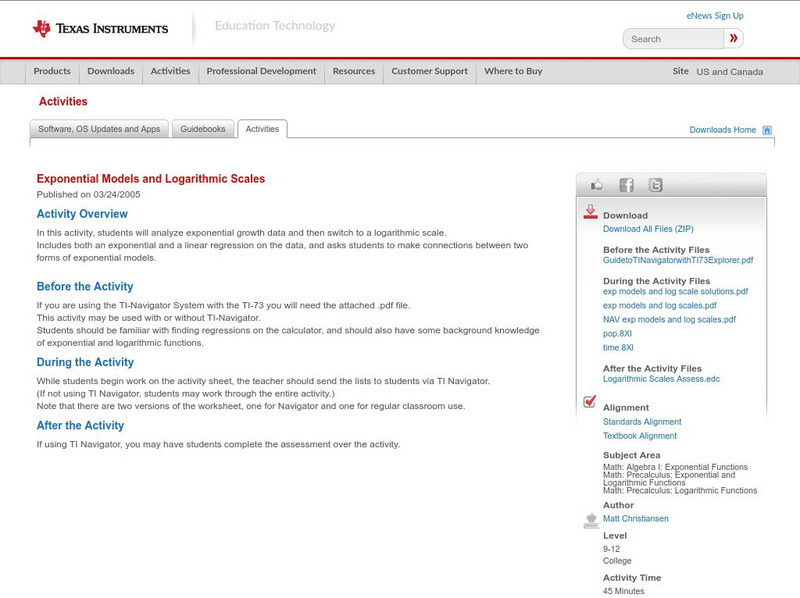
Texas Instruments: Exponential Models and Logarithmic Scales
In this activity, students will analyze exponential growth data and then switch to a logarithmic scale. Includes both an exponential and a linear regression on the data, and asks students to make connections between two forms of...
Texas Instruments
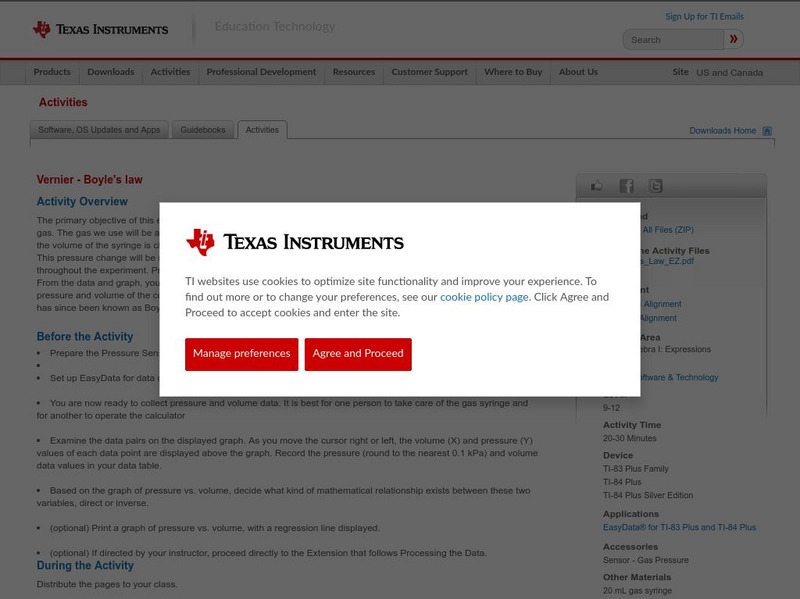
Texas Instruments: Vernier Boyle's Law
The primary objective of this experiment is to determine the relationship between the pressure and volume of a confined gas. The gas we use will be air, and it will be confined in a syringe connected to a Pressure Sensor (see Figure 1)....

Texas Instruments
Texas Instruments: Home for the Holidays
Thanksgiving Holiday activity for Algebra students. Linear data taken from the internet and used to create a linear model of the class data.Students will then discover the slope of the line is the speed of the car in miles per hour....
Texas Instruments
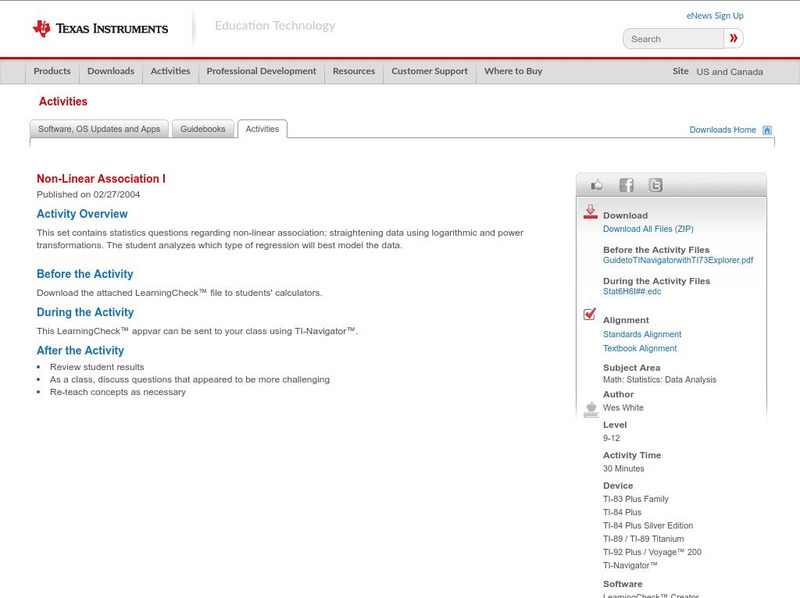
Texas Instruments: Non Linear Association I
This set contains statistics questions regarding non-linear association: straightening data using logarithmic and power transformations. The student analyzes which type of regression will best model the data.
Texas Instruments
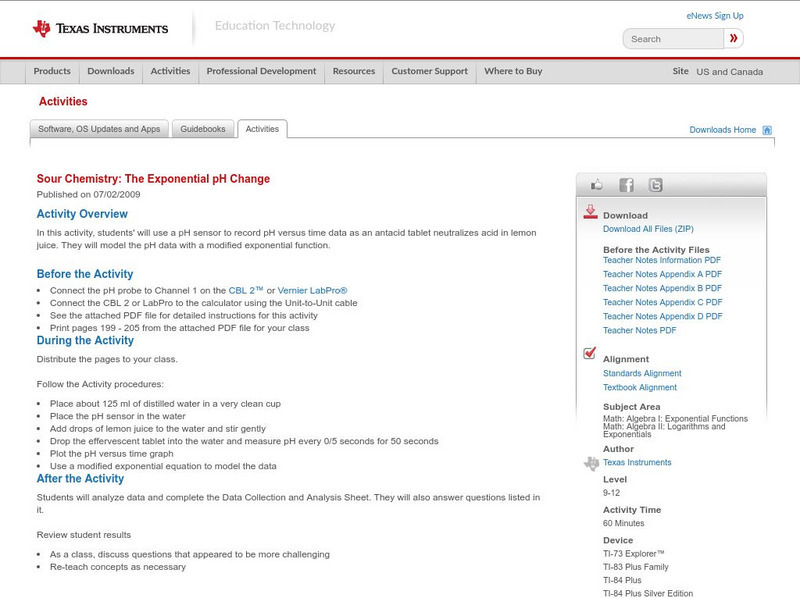
Texas Instruments: Sour Chemistry: The Exponential P H Change
In this activity, students' will use a pH sensor to record pH versus time data as an antacid tablet neutralizes acid in lemon juice. They will model the pH data with a modified exponential function.
Texas Instruments
Texas Instruments: Exploring Linear Equations
This activity uses the Transformation Graphing Application to explore the linear equation after entering data into lists and doing a statistical plot of the data.
Texas Instruments
Texas Instruments: Graph It in Pieces: Piecewise Defined Functions
In this activity, students' will record motion data for a walker and describe segments of the walker's motion using linear function. They will model the motion data using a piece-wise continuous function assembled from linear functions.