Hi, what do you want to do?





Texas Instruments
Texas Instruments: Testing Goodness of Fit and Two Way Table Chi Square
Students perform chi-square tests to see if data follows a hypothesized distribution. They also study the two-way table analysis.
Texas Instruments
Texas Instruments: Jason: Land Erosion Running Off With Soil
Rainforests at the Crossroads: Examine the relationship between rainfall and runoff on Barro Colorado Island (BCI) over a period of one year. Then examine the data and use the TI-73 Explorer to graph and analyze the values.
Texas Instruments
Texas Instruments: Mc Dougal Littell Algebra 1: Perform Linear Regression
Students can use the TI-84 Plus family to enter data, do a scatter plot and find the line of best fit and explain how they could use it to predict future values.
Texas Instruments
Texas Instruments: Math Today Breast Cancer Risks
Cross curricular lines while integrating technology into your classroom to study a real-world application of logistic regression. This activity shows students how to enter data into their graphing calculators and perform a regression in...
Texas Instruments
Texas Instruments: Burning Volumes
An analysis of how the volume of various jars impacts the burning time of candles. Data collected will be used to explore modeling, line fitting and linear regression Using graphing calculators.
Texas Instruments
Texas Instruments: Phases of the Moon
In this TI InterActive! activity, students study the phases of the moon, plot the fraction of the moon showing each day in a month, and fit the data with an appropriate trigonometric function.
Texas Instruments
Texas Instruments: Numb3 Rs: Dialing Ben
Based off of the hit television show NUMB3RS, this lesson has students try to discover if there has been a significant change in cell phone use over the course of ten days. If so, this "change point" can be detected by creating a line of...

Texas Instruments
Texas Instruments: Get on the Stick
In this activity, students use a CBR 2 to measure the reaction time of catching a stick. They also learn how to interpret a box plot, and make a five number summary of a single variable data set.
Texas Instruments
Texas Instruments: Math a Review 1
This StudyCards stack enables students to review concepts in algebra, arithmetic, and geometry, in preparation for the Math A Exam held in New York. They solve problems involving scientific notation, factoring, linear equations, rate of...
Texas Instruments
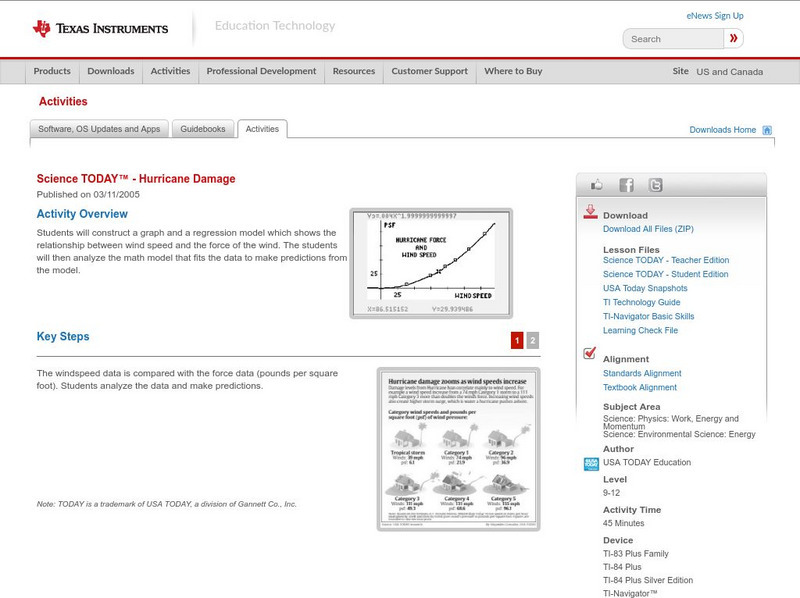
Texas Instruments: Science Today Hurricane Damage
Students will construct a graph and a regression model which shows the relationship between wind speed and the force of the wind. The students will analyze the math model that fits the data to make predictions from the model.
Texas Instruments
Texas Instruments: Newton's Law of Cooling and the Calculus Behind It
In this activity, students investigate Newton's Law of Cooling and determine a model to represent the data.
Texas Instruments
Texas Instruments: Swinging Along
Students model the data from the motion of a pendulum by a periodic function. They relate its parameters to the time for one period, the distance it is pulled back, and its distance from the motion detector.
Texas Instruments
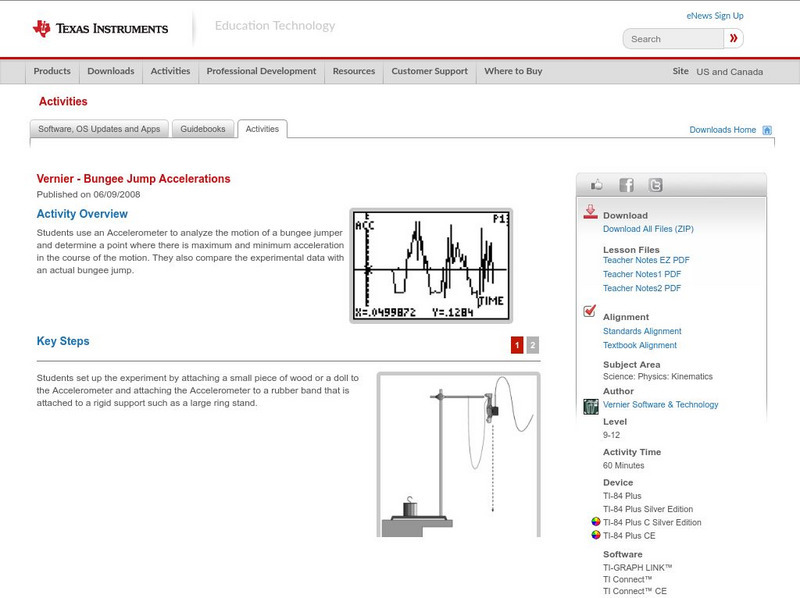
Texas Instruments: Bungee Jump Accelerations
Students use an Accelerometer to analyze the motion of a bungee jumper and determine a point where there is maximum and minimum acceleration in the course of the motion. They also compare the experimental data with an actual bungee jump.
Texas Instruments
Texas Instruments: Keep It Bottled Up: Linear Rates of Pressure Increase
In this activity, students' examine how temperature affects the rate of gas production during a chemical reaction. They measure this rate by recording the pressure variation using a pressure sensor and model the pressure data using a...
Texas Instruments
Texas Instruments: Math Today Humidity Makes Air Feel Even Hotter
Students note the range of heat indexes on the overall data as well as specific humidity levels and air temperatures. They find the mean and median of the ranges and calculate apparent temperatures for specific scenarios.
Texas Instruments
Texas Instruments: Two Hot, Two Cold
In this activity, students collect Celsius and Fahrenheit temperature data for various cities across the world. They develop and test a mathematical relationship between the two temperature scales.
Texas Instruments
Texas Instruments: A Sweet Drink Adventure 7
Students determine how the temperature of water affects the dissolving time of a sugar cube. They create, interpret and analyze graphs of data, find an equation of the line of best fit, and relate slope to rate of change.
Texas Instruments
Texas Instruments: Create Box and Whisker Plots
Students use a graphing calculator to create box-and-whisker plots and learn the usefulness of them. Students identify the five summary statistical values of data sets - minimum, first quartile, median, third quartile, and maximum values.
Texas Instruments
Texas Instruments: What Goes Up: Position and Time for a Cart on a Ramp
In this activity, students' will use a motion detector to measure how the position of a cart on a ramp changes with time. They will then determine a parabolic model for the position data using the intercepts.
Texas Instruments
Texas Instruments: Statistics With List Editor App
The list editor provides a means for viewing, editing, and working with data lists. Students can explore distributions, tests, intervals, multiple regression, random sampling, goodness of fit and inferential statistics.

Texas Instruments
Texas Instruments: Math Today Wildfire Deaths
In this activity, students will be asked to use the "Wildfire deaths" data to determine a linear model. They will examine the affect an outlier has on the model and compare methods to determine the best model.
Texas Instruments
Texas Instruments: An Average Lunch?
Students explore the meaning of the average (mean) value for a set of data.

Texas Instruments
Texas Instruments: Adding Marbles
Each time students add ten marbles to a container filled with a small amount of water, they measure the height of the water. Students will examine their data and develop linear equations.
Texas Instruments
Texas Instruments: Exponential Growth Experiment
Students will work in pairs and will conduct a growth experiment. They will record their answers for 7 to 10 trials. They will make a scatterplot of their data and share their graphs with the class.