Hi, what do you want to do?






Texas Instruments
Texas Instruments: Boyle's Law
An inexpensive and effective setup for Boyle's law. The students experiment and perform data analysis to "discover" Boyle's Law.
Texas Instruments
Texas Instruments: Glencoe Algebra 1: Graphing Calculator Investigation Curve
Students will make scatter plots and find the appropriate regression equations that best fit the data.
Texas Instruments
Texas Instruments: Jason: Disappearing Kelp Forest
From Shore to Sea: Examine the relationship between kelp plants and sea urchins, and the effects of severe El Nino events on their populations by using data collected by researchers at Johnson's Lee South on the island of Santa Rosa.
Texas Instruments
Texas Instruments: Math Today Population on the Move
In this activity students will determine the rate of change (slope) & build a linear model (y = mx + b) from this data. The model will be used to make a prediction about the future growth of the population of the U.S. if the current...
Texas Instruments
Texas Instruments: Animal Skin Adventure 6
In this adventure, students make two models to simulate the cooling rate of different skin surface areas and determine the effect of skin surface area on the results. Students graph temperature as a function of time, interpret, and...
Texas Instruments
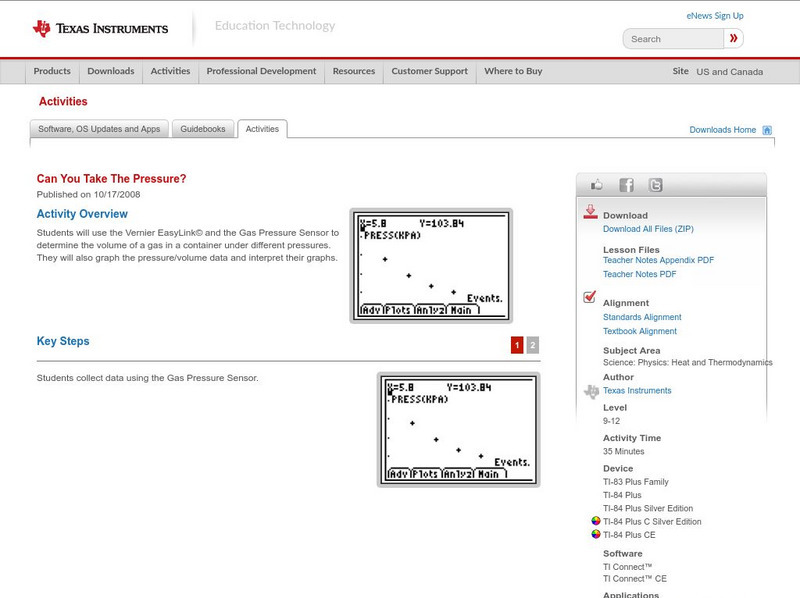
Texas Instruments: Can You Take the Pressure?
In this activity you will: Use the EasyLink and the Gas Pressure Sensor. Determine the volume of a gas in a container under different pressures. Graph pressure/Volume data. Interpret the graphs.

Texas Instruments
Texas Instruments: Selection Direction
In this activity you will produce histograms using the Data Graphs Wizard and learn about the concept of biological variance.
Texas Instruments
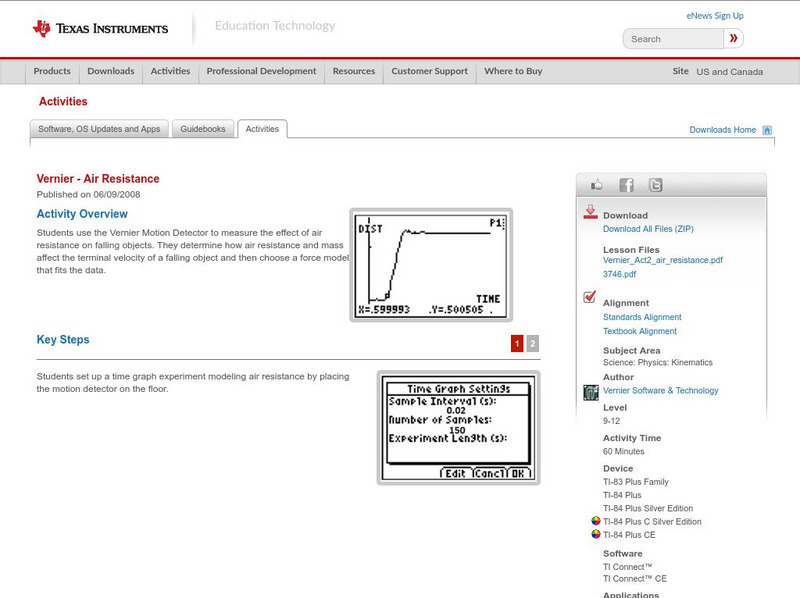
Texas Instruments: Air Resistance
Students use the Motion Detector to measure the effect of air resistance on falling objects. They determine how air resistance and mass affect the terminal velocity of a falling object and then choose a force model that fits the data.
Texas Instruments
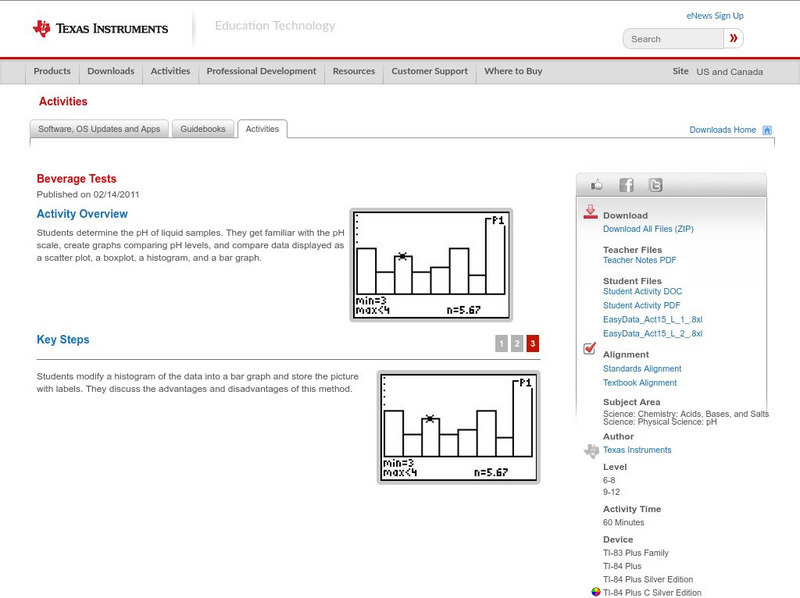
Texas Instruments: Beverage Tests
In this activity, students determine the pH of liquid samples. They get familiar with the pH scale, create graphs comparing pH levels, and compare data displayed as a scatter plot, a boxplot, a histogram, and a bar graph.
Texas Instruments
Texas Instruments: Swinging Ellipses: Plotting an Ellipse
In this activity, Students can use a motion detector to record the position and velocity of a swinging pendulum. They will plot the data as a velocity versus position phase plot and determine an ellipse that fits it.
Texas Instruments
Texas Instruments: The Linear Force Relation for a Rubber Band
In this activity, students' will use a force sensor and a motion detector to study the relationship between the force applied to a rubber band and the distance to which it stretches. They will then model force versus strech data with a...
Texas Instruments
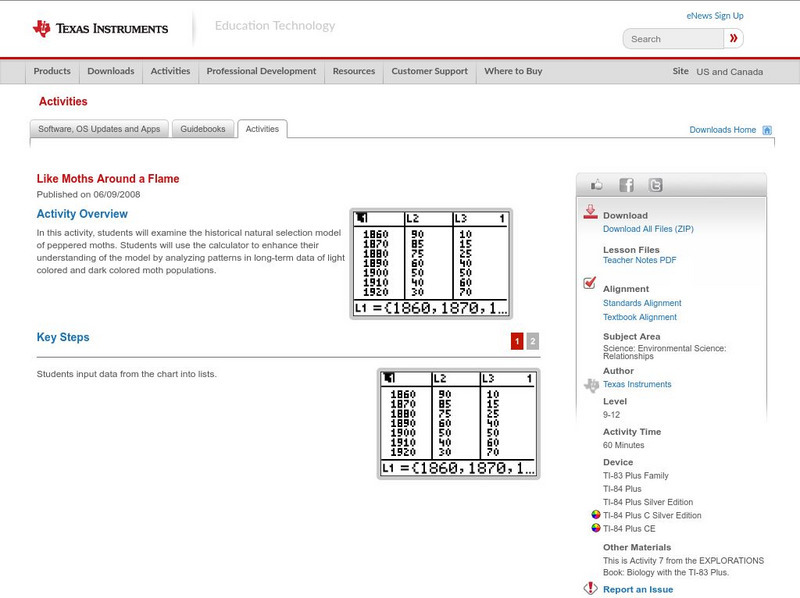
Texas Instruments: Like Moths Around a Flame
In this activity, students will examine the historical natural selection model of peppered moths. Students can use the calculator to enhance their understanding of the model by analyzing patterns in long-term data of light colored and...
Texas Instruments
Texas Instruments: Discovering Algebra: Decreasing Exponential Model & Half Life
Students will explore exponential equations that model real-world decay data.
Texas Instruments
Texas Instruments: Statistics
In this activity, students use the statistical features of the calculator to calculate statistical results, perform regressional analyses, and graphically display statistical data.

Texas Instruments
Texas Instruments: Titration Curves: An Application of the Logistic Function
In this activity, Students can use a pH sensor to record pH versus base volume data for an acid base titration. They will manually model the curve using a logistic function.
Texas Instruments
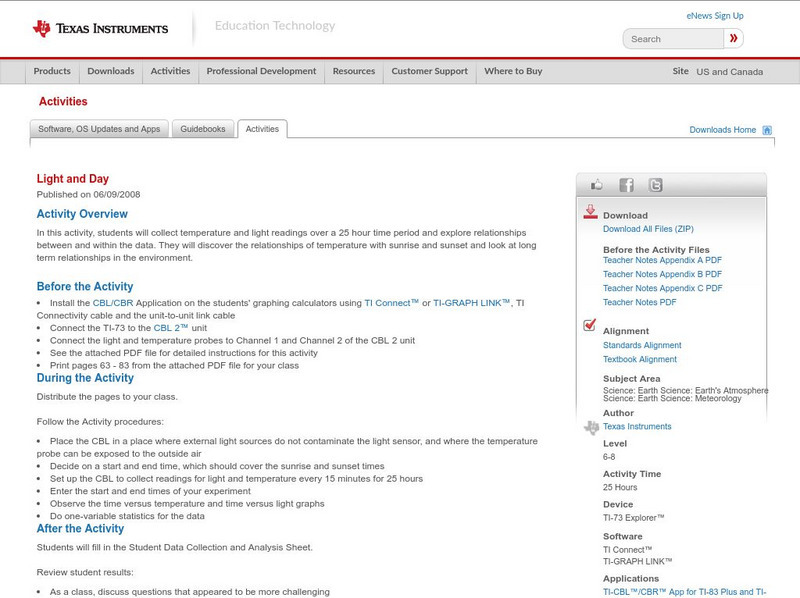
Texas Instruments: Light and Day
In this activity, students will collect temperature and light readings over a 25 hour time period and explore relationships between and within the data. They will discover the relationships of temperature with sunrise and sunset and look...
Texas Instruments
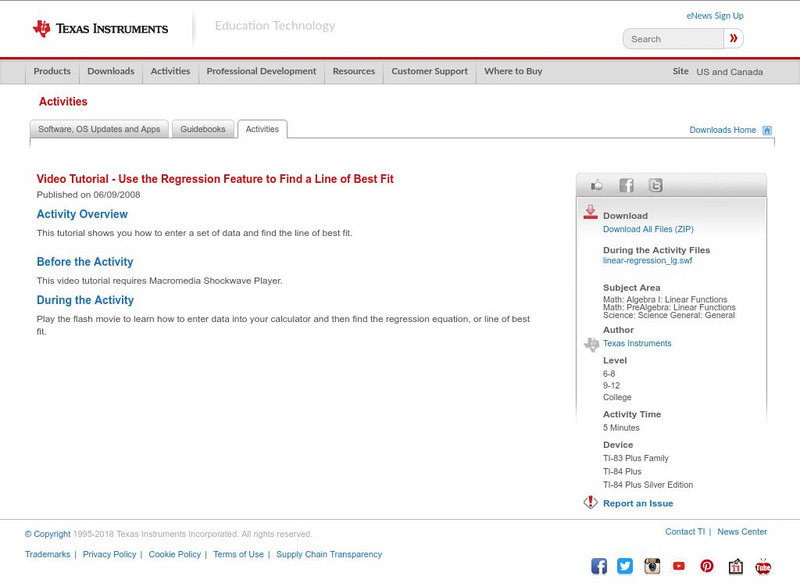
Texas Instruments: Use the Regression Feature to Find a Line of Best Fit
This tutorial shows you how to enter a set of data and find the line of best fit.
Texas Instruments
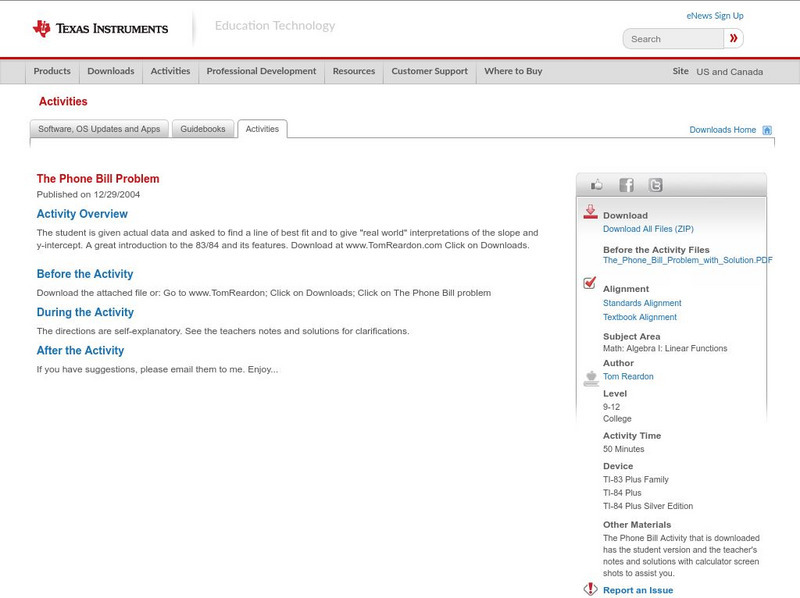
Texas Instruments: The Phone Bill Problem
The student is given actual data and asked to find a line of best fit and to give "real world" interpretations of the slope and y-intercept. A great introduction to the 83/84 and its features.
Texas Instruments
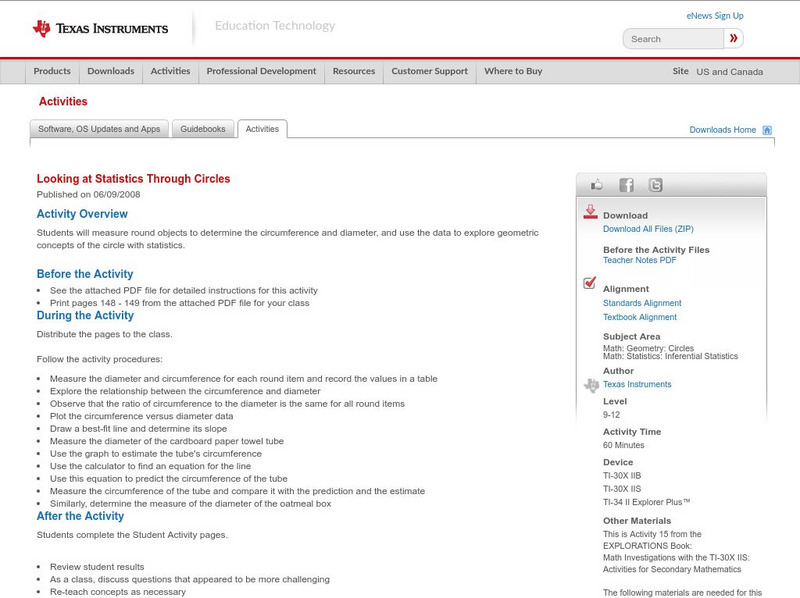
Texas Instruments: Looking at Statistics Through Circles
In this activity, students will measure round objects to determine the circumference and diameter, and use the data to explore geometric concepts of the circle with statistics.
Texas Instruments
Texas Instruments: Active Wear Adventure 10
In this adventure, students test which solar collector--black, white, or silver-- absorbs the most heat. They compare the difference between absorption and reflection. They create, interpret and analyze graphs of data. They also relate...
Texas Instruments
Texas Instruments: "The Sound of Music"
This activity will use tuning forks and the CBR to gather sound wave data for students to use to write Sine (or Cosine) functions. In this activity we study waves of known musical notes before studying waves of unknown musical notes. I...
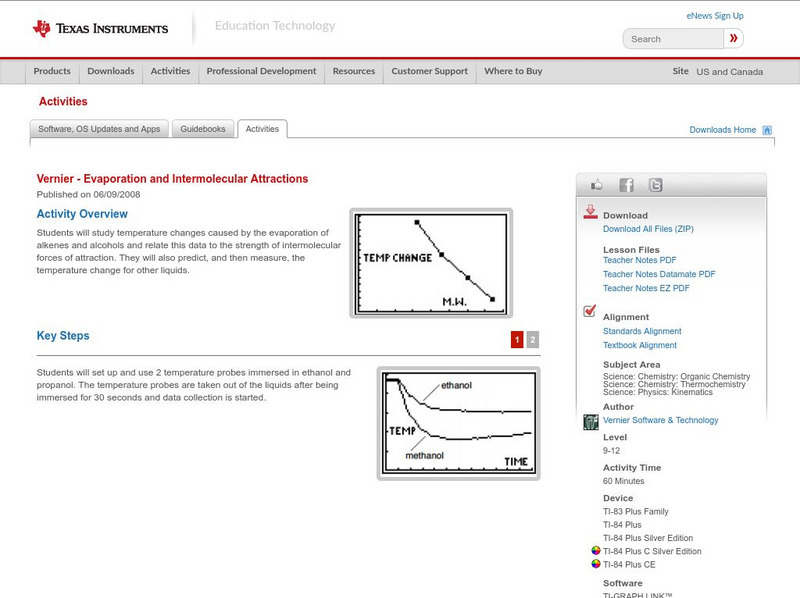
Texas Instruments
Texas Instruments: Evaporation and Intermolecular Attractions
Students will study temperature changes caused by the evaporation of alkenes and alcohols and relate this data to the strength of intermolecular forces of attraction. They will also predict, and then measure, the temperature change for...
Texas Instruments
Texas Instruments: Exponential Regression
In this activity, students perform exponential regression on a data set.
Texas Instruments
Texas Instruments: Numb3 Rs: Candy Land
Based off of the hit television show NUMB3RS, this lesson introduces students to the chi-squared statistical analysis. Although not completely in depth, the lesson does expose students to degrees of freedom, a simple chi-squared formula,...