TED Talks
Ted: Ted Ed: Average Speed and Rich Eisen's Ineptitude in the 40 Yard Dash
At the 2010 NFL draft, NFL Network anchor Rich Eisen was dared to run the 40-yard dash. The 40-something reporter in a suit was no match for the 22-year-old NFL draft prospects. Eisen's colleagues put together this segement mocking his...
PBS
Pbs Learning Media: Firefighter Training
In this video segment from Cyberchase, Harry decides to train as a firefighter and uses line graphs to chart his physical fitness progress.
CK-12 Foundation
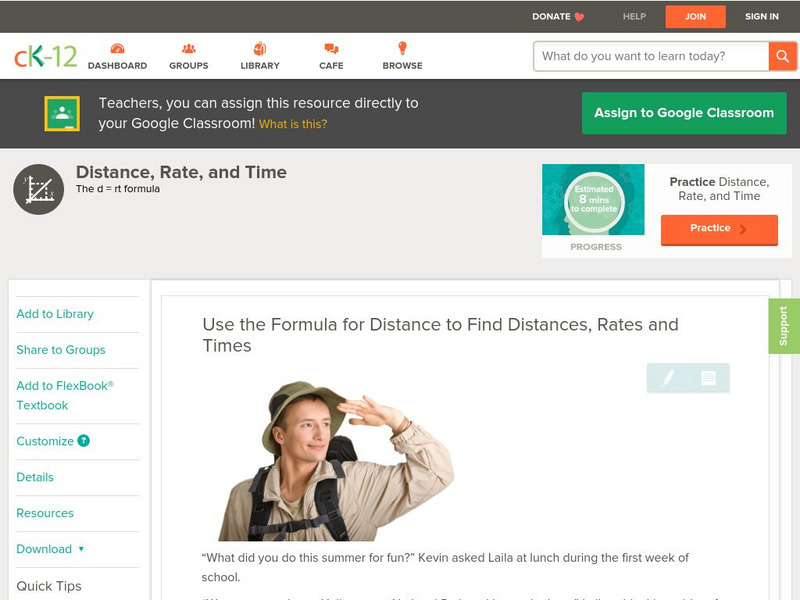
Ck 12: Algebra: Formulas for Problem Solving
[Free Registration/Login may be required to access all resource tools.] Calculate distances, rates and times by using formulas
Science4Fun
Science4 Fun: Speed and Velocity
What is speed? What is velocity? Illustrated discussion of speed and velocity including how they are measured.
Texas Education Agency
Texas Gateway: Changes in Motion
Given diagrams or scenarios, students will measure and graph changes in motion.
TeachEngineering
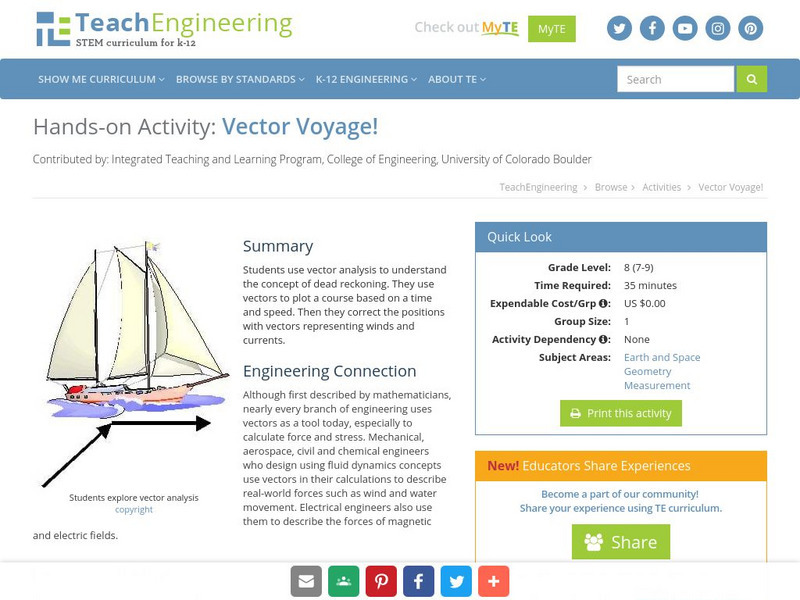
Teach Engineering: Vector Voyage!
In this activity, students will use vector analysis to understand the concept of dead reckoning. Students will use vectors to plot their course based on a time and speed. They will then correct the positions with vectors representing...
Other
Machine Head Software: Speed Distance Time Calculators
A collection of calculators to find the average speed, time, or distance depending on the variables given.
Math Open Reference
Math Open Reference: Average Velocity and Speed
Gain an understanding of average velocity and speed with this helpful reference tool. Provides a detailed definition and examples that enhance further explanation. Includes links to related topics.
CK-12 Foundation
Ck 12: Plix: Motion: Changing Speeds
[Free Registration/Login Required] Drag the red dot to draw a position-time graph for a sprinter with changing speeds.
BBC
Bbc: Gcse Bitesize: Describing Motion Aqa
This lesson focuses on Distance-time graphs; the gradient of a distance-time graph represents the speed of an object.
Science Education Resource Center at Carleton College
Serc: Motion: Investigating Motion Graphs
For this lesson, students investigate motion graphs. Students predict what the distance-time graph and velocity time graph would look like for a student walking across the room for three different scenarios.
Education Development Center
Tune in to Learning: Get Going With Rate
Explore the concepts of rate, distance, and speed in this interactive lesson. Discover how to use formulas to solve word problems and calculate salaries. A concise lesson with excellent examples, connections to real world experiences,...
Alabama Learning Exchange
Alex: The Need for Speed
After viewing an introductory illustrated podcast on speed, distance, time, and velocity, students explore distance-time graphs using interactive websites. Working in cooperative learning groups, students will investigate the motion of...
Purdue University
Purdue University: An S and P Wave Travel Time Simulation
A classroom simulation modeling how earthquake waves travel through Earth at different speeds. A graph is constructed to demonstrate the relationship between the distance and time of travel of seismic waves, and then used to locate the...
TeachEngineering
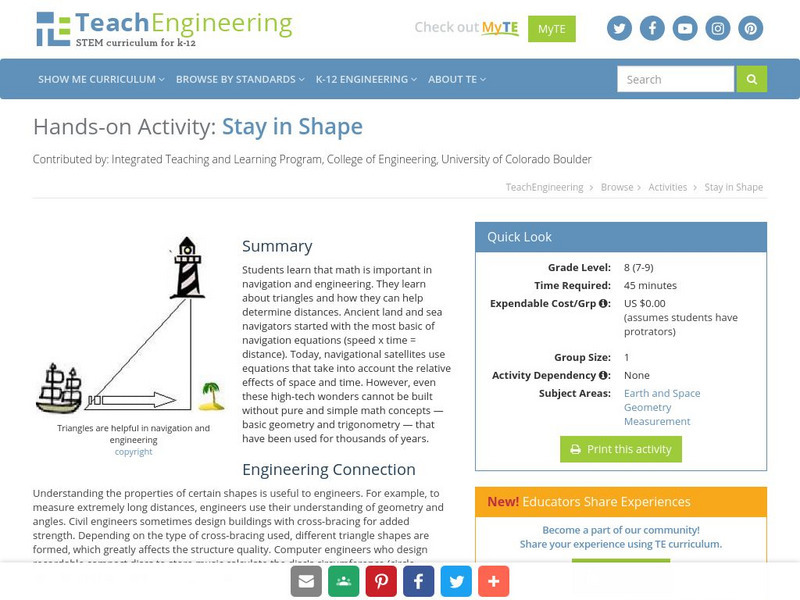
Teach Engineering: Stay in Shape
In this activity, students will learn that math is important in navigation and engineering. Ancient land and sea navigators started with the most basic of navigation equations (Speed x Time = Distance). Today, navigational satellites use...
PBS
Pbs Learning Media: Space Math Scale of the Solar System
Practice Space Math! Math is the cornerstone of space travel. Familiarize yourself with all the ways math can help you study the solar system. Practice math problems in areas such as speed of light, the distance of planets to the sun,...
CK-12 Foundation
Ck 12: Physics: Motion Study Guide
This study guide on motion covers some key vocabulary and terms to describe motion: displacement vs. distance, acceleration, speed vs. velocity, and instantaneous vs. average. It includes graphs showing distance vs. time, velocity vs....
Geographypods
Geographypods: Global Interactions: Changing Space the Shrinking World
This learning module examines how the world has become smaller as time and space have converged. Transportation is much faster, making places more accessible, goods can be more quickly and easily transported, and the Internet connects...
Science Buddies
Science Buddies: Drag Racing in the Water
It's fun to go swimming. To feel the power of your body as you launch yourself into the water. But did you know that swimming isn't just about skill and athleticism? The human body consists of skin, contours, and curves. How the water...
Science and Mathematics Initiative for Learning Enhancement (SMILE)
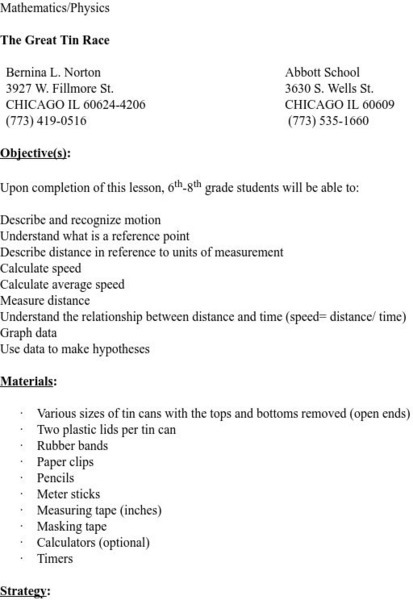
Smile: The Great Tin Race
This activity is a great way to show distance and time relationships while incorporating charts and graphing. Different sized tins are raced against each other, and data is collected.
National Council of Teachers of Mathematics
Nctm: Figure This: Gasoline Tanks
Inquiring minds want to know, how far can you go on a tank of gas? See if you can figure out this math challenge that explores rate, distance, and time. A one page activity from the NCTM Math Challenges for Families series. Application...
Alabama Learning Exchange
Alex: Sonar Mapping of the Ocean Floor
Mapping the ocean floor must be done by indirect observation. One method involves bouncing a sonar signal off of the ocean floor and measuring the length of time this signal takes to return. This length can be translated into distance:...
TeachEngineering
Teach Engineering: Navigating by the Numbers
For this lesson, middle schoolers will learn that math is important in navigation and engineering. Ancient land and sea navigators started with the most basic of navigation equations (Speed x Time = Distance). Today, navigational...
Texas Instruments
Texas Instruments: Shape Up!
In this activity, students can use the motion detector to record motion, and observe how the direction of movement, speed of travel, and the rate of change of direction and speed affect the shape of a distance-time plot.
Other popular searches
- Speed Distance Time
- Speed and Distance Time
- Speed, Distance and Time
- Speed Distance Time Problems
- Distance/speed/time
- Graphing Speed Distance Time
- Distance Time Speed Graph
- Speed, Distance, Time
- Physics Speed Distance Time


