Texas Instruments
Texas Instruments: Match Me!
In this activity, students move in a specific way in front of the motion detector to create motion plots that match a given Distance versus Time plot. They make connections between types of movements and characteristics of Distance-Time...
Texas Instruments
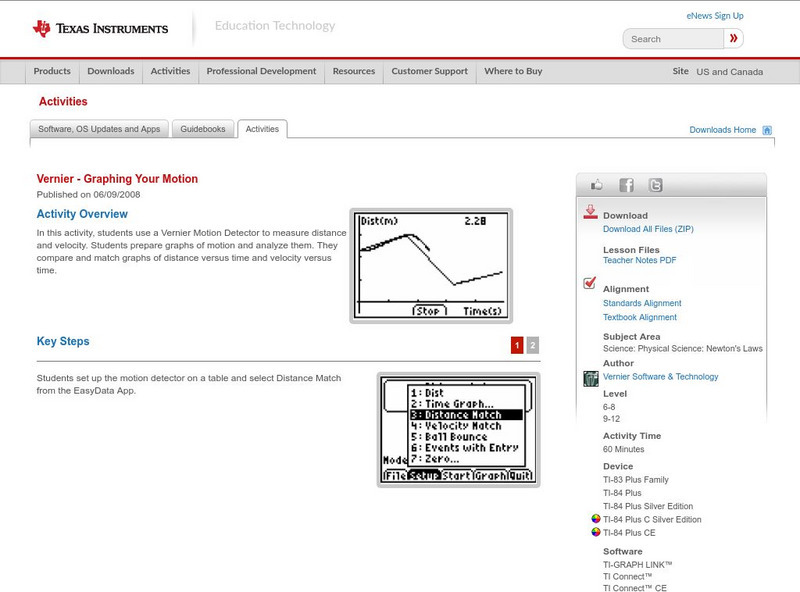
Texas Instruments: Graphing Your Motion
In this activity, students use a Motion Detector to measure distance and velocity. Students prepare graphs of motion and analyze them. They compare and match graphs of distance versus time and velocity versus time.
Texas Instruments
Texas Instruments: Falling Down Adventure 5
Students use the CBR 2 to study how a change in mass affects the average speed of a falling object. They graph distance as a function of time, and interpret and analyze graphs representing motion.
Illustrative Mathematics
Illustrative Mathematics: 8.g Bird and Dog Race
In this race between a bird and a dog, 8th graders are provided with information about their starting locations on a map and their speeds. They are asked to predict a winner, draw the paths they might follow, decide how to determine who...
Sophia Learning
Sophia: Velocity: Lesson 3
This lesson will introduce the concept of velocity, explaining what it is, how it is calculated, and common units used to represent it. It is 3 of 3 in the series titled "Velocity."
PBS
Pbs Learning Media: The Fastest Broom
The CyberSquad tests which broom can travel the furthest in five seconds in this video from Cyberchase.
Illustrative Mathematics
Illustrative Mathematics: 7.rp Walk a Thon 2
The purpose of this task is for students to translate information about a context involving constant speed into information presented in a table and to find the time it takes to travel a unit distance as well as the distance traveled per...
Illustrative Mathematics
Illustrative Mathematics: N q.a.3: Bus and Car
This task it is an exploration of the relationship between speed, distance, and time. An understanding average speed gives an opportunity to address common confusion between average speed and the average of the speeds for the two...
Texas Instruments
Texas Instruments: The Science of Racing: Hitting the Mark
Since running a race car is VERY expensive, race engineers know a great deal about how speed, time and distance relate. In this activity, you will investigate the relationship between distance traveled, speed and elapsed time. You will...
Physics Aviary
Physics Aviary: Practice Problems: Finding Velocity in a Ground Soccer Kick
Students must determine where a soccer ball will land based on the speed with which it is kicked. Students will also need to find the time in the air and the maximum height obtained by the projectile. This problem does not take place on...
TeachEngineering
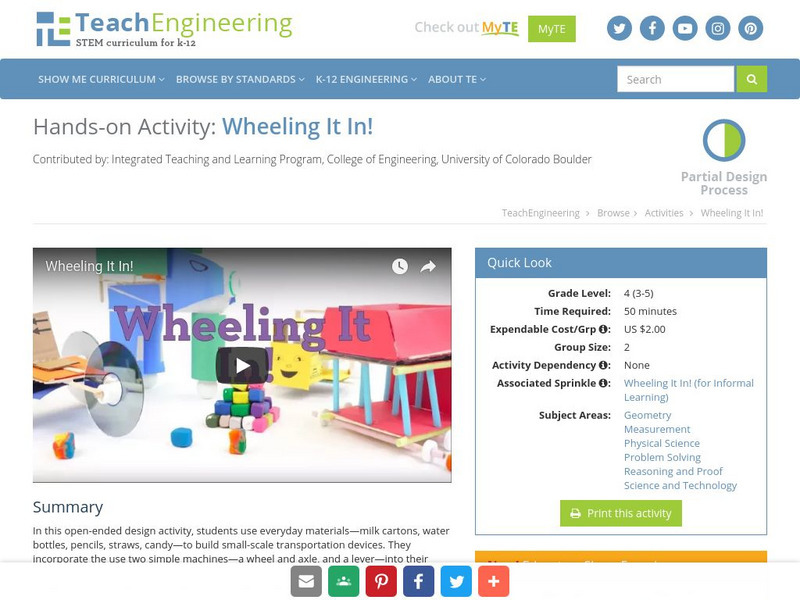
Teach Engineering: Wheeling It In!
In an open-ended design activity, students use everyday materials (milk cartons, water bottles, pencils, straws, candy) to build a small-scale transportation device. They incorporate the use of a wheel and axle, and lever into their...
PBS
Pbs: A Classical and Relativistic Trip to a Black Hole
This PBS site is a classroom activity that takes a trip to a black hole. Students apply calculations on distance, velocity, acceleration, time, circular motion, density, and more.
Physics Aviary
Physics Aviary: Practice Problems: Ground to Wall Soccer Kick Problem
Students must determine where a soccer ball will hit a wall based on the speed with which it is kicked. Students will also need to find the time in the air in milliseconds. This problem does not take place on Earth.
BBC
Bbc: Gcse Bitesize: Motion
This lesson focuses on motion including definitions, how to calculate the change in velocity and the average acceleration, and a link to an assessment.
Science Education Resource Center at Carleton College
Serc: Discovering Velocity Outside of the Classroom
A physics lab activity where students gather data from classmates running at different rates on a football field. They then share their gathered data and transfer it to a graphing program to ultimately calculate average velocity.
PBS
Pbs Teachers: Math Space Odyssey: How Long Is a Light Year?
This lesson helps students to demonstrate the ability to use a light year as a standard of measurement to calculate time and distance from the earth. They will also solve problems based on light years.
University of Cambridge
University of Cambridge: Nrich: Bike Ride
On this one page website sharpen your logic and rate measurement skills while working on this challenge. The solution is available to double check your solution.
University of Cambridge
University of Cambridge: Nrich: Walk and Ride
On this one page website sharpen your logic and rate measurement skills while working on this challenge. The solution is available to double check your solution.
University of Cambridge
University of Cambridge: Nrich: The Hare and the Tortoise
On this one page website sharpen your logic and rate measurement skills while working on this challenge. The solution is available to double check your solution.
CK-12 Foundation
Ck 12 Exploration Series: Simulations: Physics: Archery
[Free Registration/Login Required] Watch this animation as an archer shoots at a target on an angle, and its horizontal and vertical paths and its velocity are explained. An interactive follows where you can manipulate the archer's...
Science Buddies
Science Buddies: How Fast Can You Shoot a Hockey Puck?
In this project, you'll need: a puck, a hockey stick, a tape measure, at least one helper with a stopwatch and an empty rink. Have your friend start the watch just as you make contact with the puck, and stop it when the puck hits the...
Science Buddies
Science Buddies: How Fast Do Seismic Waves Travel?
Here's a geology project that uses historical seismograph data that you can collect from the comfort of your own computer. You'll use a web interface to a network of seismometers run by the Northern California Earthquake Data Center, at...
The Tech Interactive
The Tech Interactive: Tech Tip: Data Collection: Reflecting on Your Design [Pdf]
This resource explains why data collection is a great way to make informed improvements to a design, and how to do it. Data can be quantitative - such as a measurement of distance or time - or qualitative, such as an observation of...
Other
Sprk: Macro Lab Lesson 4 Percentages: Teacher Guide [Pdf]
Students will use Sphero to explore percentages using speed and color. The speed experiments are quantitative and the color experiments are qualitative. They will program the Sphero to move at 100% speed for a particular amount of time,...
Other popular searches
- Speed Distance Time
- Speed and Distance Time
- Speed, Distance and Time
- Speed Distance Time Problems
- Distance/speed/time
- Graphing Speed Distance Time
- Distance Time Speed Graph
- Speed, Distance, Time
- Physics Speed Distance Time

