Curated OER
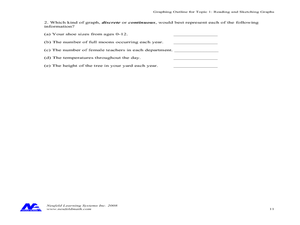
Reading and Sketching Graphs
In this graphs worksheet, students answer 15 multistep questions about graphs. Students determine distance traveled, time, velocity, and create scenarios to fit the graph.
Curated OER
Regents Exam Questions: Distance
In this distance instructional activity, students solve 12 multiple choice, short answer, and graphing problems. Students use the distance formula to find the distance between two points.
EngageNY
Introduction to Simultaneous Equations
Create an understanding of solving problems that require more than one equation. The lesson introduces the concept of systems of linear equations by using a familiar situation of constant rate problems. Pupils compare the graphs of...
Curated OER
Exploring Quadratic Data : Transformation Graphing
High schoolers analyze the vertex form of a parabola and find an approximate fit of a model. They explain the quadratic parabola function and its properties by developing quadratic models. They use translation and dilation to change the...
Curated OER
Walking the Plank
This is a cool math activity. Kids collect and interpret data based on a physical act. A board is balanced between a scale and a step, learners record a peer's weight as it decreases while s/he walks further away from the scale. They...
Balanced Assessment
All Aboard
Pupils must graph the location of a train using the time given a timetable. They analyze the different legs of the trip, graph the return trip, and compare the two graphs. The lesson ends with a discussion of similarities and differences...
Shodor Education Foundation
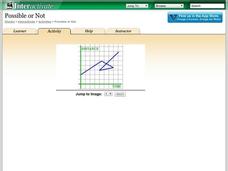
Possible or Not?
What does the graph mean? Pupils view 10 graphs and determine whether they are possible based on their contexts. The contexts are distance versus time and profit versus time.
Curated OER
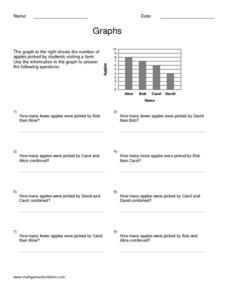
Graphs
In this graphing activity, students read information and study diagrams about graphing. Students complete 3 graphing activities.
Curated OER
Graphing Calculator Investigation - Second Degree Polynomial Functions
Students solve quadratic functions. In this solving quadratic functions lesson, students determine the height of an object at a given time. Students determine the time at which an object hits the ground. Students answer questions...
Curated OER
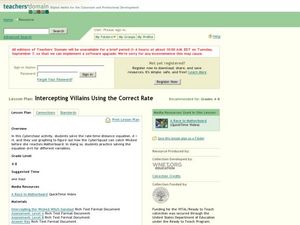
Intercepting Villans Using the Correct Rate
A Cyberchase video introduces the distance = rate x time equation. Participants then calculate answers to proposed problems and graph a series of results that is then incorporated into a game to help cement the concept. A thorough and...
Curated OER
Functions and Graphing
Graphing functions in a real world application makes math come to life. Learners graph points on a coordinate plane and identify various points on a graph by working through a set of real world problems. This is a perfect review exercise.
EngageNY
Comparing Linear Functions and Graphs
How can you compare linear functions? The seventh installment of a 12-part module teaches learners how to compare linear functions whose representations are given in different ways. They use real-world functions and interpret features in...
Illustrative Mathematics
Bike Race
A graph not only tells us who won the bike race, but also what happened during the race. Use this resource to help learners understand graphs. The commentary suggests waiting until the end of the year to introduce this topic, but why...
Curated OER
RCX Car Line Graph
Students develop a line graph based on distances that an RCX car drives in specified amounts of time. They then are given a specific amount of time for the car to drive and be asked to extrapolate the car's distance from the graph.
Curated OER
The Barbie Bungee Drop
What do math, bungee jumping, and Barbie® have in common? Young adventure seekers use rubber bands as bungee cords to predict a thrilling, but safe, jump for their doll. First, test jumps are conducted with a few rubber bands. Then more...
Curated OER
Speed
Fifth and sixth graders practice working in pairs to determine whether they can walk with constant speed. They test themselves, collect their data, draw graphs with their data collected, manipulate the data, and then draw conclusions...
Curated OER
Now That's Using Your Head!
Explore linear measurement. Scholars will measure the circumference of their head and the distance they can jump. Information is recorded, averages are calculated, and a data table is completed. They then determine possible relationships...
Curated OER
Barbie Bungee
Middle and high schoolers collect and analyze their data. In this statistics lesson plan, pupils analyze graphs for linear regression as they discuss the relationship of the function to the number of rubber bands and the distance of the...
Utah Education Network (UEN)
The Human Line Plot
Learners collect data and use charts and line plots to graph the data. Some excellent worksheets and activities are embedded in this fine lesson on line plots.
Curated OER
The 100 Meter Race Problem
In this meter worksheet problem, students read a word problem and interpret a graph. They use the derived information to determine time and distance. This one-page worksheet contains 1 multi-step problem. Answers are provided at the...
Curated OER
Functions As Graphs Worksheet
In this math worksheet, young scholars graph the data given in the organizer. The functions are used to create the new line for finding the possible unknowns.
Curated OER
Buses
Busy buses bustling back and forth. For this middle school assessment task, learners use information given in a graph to answer questions about bus schedules. They then determine how many times a bus passes by other buses going in the...
Illustrative Mathematics
Distance across the channel
Here you will find a model of a linear relationship between two quantities, the water depth of a channel and the distance across the channel at water level. The cross section of the channel is the shape of an isosceles trapezoid. The...
Curated OER
Interpreting Functions
Interpreting graphs of functions is addressed in a short worksheet. Distance as a function of time is sketched on a graph, and a few quick questions ask about their meaning. This would make a good short assessment, or a nice worksheet to...
Other popular searches
- Distance Time Graphs
- Distance Time Graphs Physics
- Distance vs Time Graphs
- Distance and Time Graphs
- Distance vs. Time Graphs
- Distance Time Graphs


