Curated OER
Power in the Tubes
Eighth graders investigate the relationship between force, distance and time. In this physical science lesson students compute the work done, graph and find the relationship between work and power.
Curated OER
Measuring & Graphing Motion
Fifth graders study how to measure distance. In this graphing motion lesson students complete a lab activity that shows them on the computer how to make graphs.
Curated OER
Linear Motion 5
For this linear motion worksheet, students answer 9 questions about velocity, acceleration and position of objects. They solve problems for acceleration and velocity and they interpret graphs of velocity vs. time, acceleration vs. time...
Curated OER
Straight Line Motion in Two Parts
Students describe and quantify the motion of toy cars. In this motion lesson plan, students observe a battery powered toy car on a flat surface and a standard toy car on a sloped surface. They write their observations, measure average...
Curated OER
Linear Motion 6
In this linear motion activity, students answer 12 questions about acceleration, velocity and distance traveled. They interpret diagrams and indicate the location of an object if it has positive, negative or no acceleration. They...
Curated OER
Linear Motion 3
In this linear motion activity, students answer 11 questions including finding acceleration of moving objects, finding the distance objects travel and finding the time it takes objects to move a particular distance. Students interpret...
Curated OER
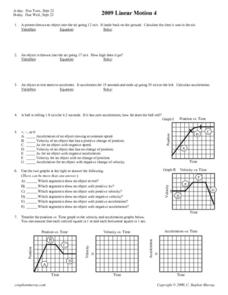
Linear Motion 4
For this linear motion worksheet, students answer 12 questions including finding acceleration of moving objects, calculating distance objects travel and determining the time of travel. Students interpret graphs of position vs. time,...
Curated OER
Momentum
In this momentum activity, students answer 17 questions about momentum of objects. They calculate momentum given mass and distance traveled in a given amount of time and they use graphs of position vs. time to find momentum.
Edmond Public Schools
8th Grade Science Resource Book: Unit 2 - Physics
Get things moving with this extensive collection of physical science resources. Covering the fundamentals of measurement, graphing, lab safety, and experimental design as well as the specific scientific concepts of velocity,...
Curated OER
Graphing Speed; Slope
In this graphing speed learning exercise, students find the slope in a position vs. time graph to be the speed. They are given example graphs of position vs. time to show the changes in slope reflect the changes in speed. Students match...
Curated OER
"Graphing Your Motion"
Students study the concepts of motion, velocity, and acceleration through graphing their own movement using LoggerPro. They explain the difference between speed and velocity using the weather vane example. They discover the difference...
Curated OER
Calculating & Graphing Using a Spreadsheet
Students use the lab apparatus to calculate the average velocity and average acceleration at several points and record the data. They use the spreadsheets to plot distance vs. time, velocity vs. time and acceleration vs. time graphs.
Curated OER
Comparing Distance/Time Graphs to Speed/Time Graphs
In this graphing the motion of objects learning exercise, students compare graphs of distance vs. time and speed vs. time of objects moving at constant speed, accelerating, slowing down, and stopped. Students identify the movement of a...
Curated OER
Motion of a Bowling Ball
Students experiment with distance, speed, and motion by graphing the motion of a bowling ball. In this distance versus time graphing lesson, students observe the speed and distance of a rolling ball and graph their findings. They then...
Curated OER
CEEnBoT Stories
Students identify the slope of a line as negative, positive, zero or undefined. In this algebra lesson, students identify the distance versus the time using graphs of linear equation. They use the robot and the CEENBoT program to analyze...
Curated OER
Straight Line Motion with a Stomper
Learners explore average speed, and graph distances and time. In this speed and velocity lesson students complete a lab then calculate distances, acceleration and velocity and graph the data.
Curated OER
Faster speed-Shorter Time
Young scholars calculate the inverse variation, and speed given the formulas. In this algebra lesson, students investigate properties of conics, focusing on the hyperbola. They identify the distance between the directrix and other parts...
Curated OER
Graphing Your Motion
Seventh graders investigate velocity and speed. In this Vernier Probe lesson, 7th graders will use probes to calculate motion, speed, and velocity of an object. They will create a graph of their collected data.
Curated OER
Time and Rate
In this rate graphing worksheet, students graph four examples of rate vs. time. Then students complete 20 short answer questions.
Curated OER
Discovering Pi/Welcome to Pi Day
Students explore pi. In this circle measurement lesson plan, students define and identify radius, diameter, circumference, and perimeter. Students work in groups to measure several plastic lids and record their findings. Students compare...
Curated OER
Waves Through Earth: Interactive Online Mac and PC
Students participate in a JAVA activity to vary the seismic P and S wave velocity through each of four concentric regions of Earth. They match "data" for travel times vs. angular distance around Earth's surface from the source to detector.
Curated OER
Describing the Motion of a Battery Powered Cars
Students explore distance a toy car travels by changing the amount of batteries used to power the toy car. In this force and motion lesson, students calculate the average speed of a car while investigating the power from various amounts...
Houston Area Calculus Teachers
Collecting Driving Data
Give AP Calculus classes the opportunity to check the accuracy of their calculations! A calculus activity involves the collection of data, the application of mathematics, and the analysis of the accuracy of results. Young mathematicians...
Science Matters
Finding the Epicenter
The epicenter is the point on the ground above the initial point of rupture. The 10th lesson in a series of 20 encourages scholars to learn to triangulate the epicenter of an earthquake based on the arrival times of p waves and s waves....


