Curated OER
Count The Letters
Students perform activities involving ratios, proportions and percents. Given a newspaper article, groups of students count the number of letters in a given area. They use calculators and data collected to construct a pie chart and bar...
Curated OER
THEMIS: A Magnetic Case of 'What Came First?'
In this magnetic reconnection worksheet, learners solve seven problems using the data and graphs from the THEMIS satellite constellations, which show a series of events triggered by a magnetic reconnection. Students interpret the data in...
Curated OER
Box-and-Whisker Plots
Eighth graders measure in feet and inches and convert to explore the relationship between the converted measurements. In this measurement lesson, 8th graders use the whisker and box plot to represent the measurement of a cat. ...
Curated OER
Under the Sea - Ocean Mammals/Fish
Students explore the similarities and differences between ocean mammals and fish. The characteristics of the life forms observed are placed onto a graph. The classroom becomes the botom of the sea and is explored to gain the required data.
Curated OER
Gravity, Angles, and Measurement
Students relate math to real life scenarios. In this geometry lesson, students launch a ball tracking each launch using a graph. They analyze their data for speed, angles and distance, trying to improve on each launch.
Curated OER
Population and Productivity: Two P's in a Pod
Students investigate the link between countries' population growth rates and levels of industrialization. They observe that, over time, as a country becomes more industrialized, its population growth rate decreases.
Curated OER
HW Unit 10:2-Harmonic Motion
In this harmonic motion worksheet, students answer 9 questions about pendulums, a slinky and characteristics of harmonic motion. They identify the changes in waves as the amplitude gets bigger and interpret a graph of position vs. time.
Curated OER
Oodles of Poodles
Students solve equations by graphing. In this algebra lesson, students differentiate between functions and relations. They use the TI to graph their equation and analyze the graph.
Curated OER
French Fry Fun: Estimating and Measuring
Third graders demonstrate their estimating and measuring abilities. In this length measurement lesson, 3rd graders produce estimates of how long a handful of French fries will be before physically measuring them. Students...
Curated OER
Earthquake Patterns
Students identify and interpret the cyclical nature of the Parkfield, California earthquakes. They then investigate and graph earthquake occurrences on the Mojave segment of the San Andreas fault and then on the Hayward fault in order to...
Curated OER
Animal Skin
Students investigate the skin surface to body area ratios for different animals. In this seventh/eighth grade mathematics/science lesson, students explore heat transfer between an animal’s body and the environment. Using...
Curated OER
Pumped Up Gas Prices
Students calculate gas prices. In this transportation lesson, students tally the mileage and gas costs of their car for one months. They figure out how much was spent on gas and create a graph showing average gas prices over time.
Curated OER
Latent Heat of Fusion
Students conduct a series of investigation on latent heat of fusion. In this chemistry lesson, students explain how thermal storage systems work. They draw and interpret graphs.
Curated OER
What is Log?
Young mathematicians differentiate between logs and natural logs in this algebra lesson. They solve functions and logarithmic functions. Learners also graph and rewrite the exponential and log functions.
Curated OER
Jelly Bean's Galore
Students investigate the origins of the Jelly Bean. They complete a Scavenger Hunt using the jellybean website. Pupils create a bar graph using information collected about jelly beans. Students discuss the time of year that Jelly Beans...
Curated OER
The Muckrakers Interdisciplinary Unit
Eighth graders complete an Interdisciplinary Unit on the Muckrakers and the Progressive Movement. Students describe life in America and how Progressive Reformers changed it. identify specific problems and propose solutions. Students...
Curated OER
Understanding Reconstruction in South Carolina
Eighth graders interpret historical evidence presented in primary and secondary resources. In this Reconstruction activity, 8th graders research the role of Reconstruction in South Carolina by simulating the environment of East Bay...
Curated OER
The Phone Bill Problem
Students write an equation for a linear function. In this algebra lesson, students collect data, plot it and graph it. They identify the equation of the graphed data and define the slope and y-intercept of the graph.
Curated OER
Linear Equations in Our Every Day World!
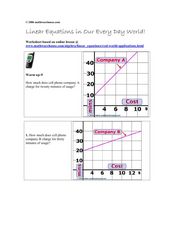
In this linear equations worksheet, students read and interpret graphed linear equations. They read a story problem, write a linear equation, and plot the points on a coordinate plane. This five-page worksheet cotnains 12...
Curated OER
Global Statistics
Students determine statistics based on data. In this statistics lesson plan, students use data and record in charts. Students create graphs based on the statistics found.
Curated OER
What Causes the Seasons?
Students conduct experiment to examine how tilt of globe influences warming caused by lighted bulb. They monitor simulated warming of their city by sun in winter and in summer by using light bulb, interpret results, and submit lab report.
Curated OER
What's A Water Column Profile?
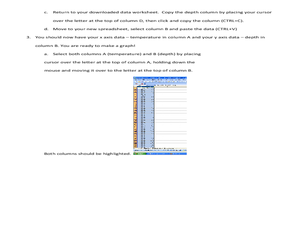
Students investigate water column data. In this earth science and seawater lesson, students determine how temperature, salinity, and density have an impact on sea water by viewing and analyzing data obtained from a number of websites....
Curated OER
Michigan Virtual Field Trip
Students analyze data from a virtual field trip to Michigan. They conduct Internet research on mileage and travel time between cities, calculate and compare fuel costs, and research and calculate lodging, activities, and meal costs.
Curated OER
The Perfect Principal
Students demonstrate their understanding of math skills. In this data analysis lesson, students complete a worksheet requiring them to calculate mean, median, and mode, and create and interpret graphs. Lesson is intended as an assessment...


