Curated OER
Harmonic Motion
In this harmonic motion worksheet, students read about the difference between harmonic motion and linear motion. They are given the parts of harmonic motion, graphs of harmonic motion and equations to find the period and frequency of...
Curated OER
Riemann Rectangle Errors
Students calculate the area under a curve. In this calculus lesson, students integrate the function to find the area under the curve. They use the Ti to create a visual of the graph.
Curated OER
What Do We Owe To Thoreau?
Students use this design as an electronic reading and writing guide to Henry David Thoreau's famous essay, "On Civil Disobedience." They use activities to familiarize students with the political issues of Thoreau's time. Comprehension...
Curated OER
A Flip of Life in the 13 Colonies
Fourth graders create a flip book illustrating the 13 original colonies. They study the growth and development of each of the three groups of the original colonies. They use maps to observe and interpret geographic information and...
Curated OER
World Consumption: Unequal Slices of the Pie
Students interpret the United Nations Human Development Reports and explain the relevance and use of the human development index in offering insight into a nation and its challenges. They draft a letter to the United Nations.
Curated OER
Planet Earth: Almost 6 Billion Served
Learners investigate the global population explosion, by comparing India's and China's population control efforts and results. They interpret the UN's Human Development Report, and conduct research on another highly-populated country.
Curated OER
Kindergarten Money
Students identify the various coins and their values through presentations, a rubric, a value pretest, and coin manipulatives. Money is incorporated into various activities whether at home or in school. Students create money webs using...
PBS
African-Americans in the American West
Secondary learners explore the westward movement of African Americans. Segmented into four time periods, the activity provides an overview of how African Americans experienced westward expansion. Learners view PBS specials on the...
Curated OER
Making Connections-Review Experimental Design and Homeostasis
For this experimental design and homeostasis worksheet, students complete 20 sentences with key terms about designing experiments, gathering data, graphing data and determining controls. They also complete sentences about homeostasis and...
Curated OER
Insect Monitoring
Students participate in an interactive activity using the scientific method to study biodiversity. In this insect monitoring activity, students simulate the layers of soil and the insects that would live there. Students design...
Curated OER
Square Foot Garden
Students plant a garden and keep track of it. In this geometrical garden instructional activity, students collect data from their garden twice a week. They graph their finding and figure out how many square feet of growing space...
Curated OER
A Colony is Born : Lessons 7 - 10 What's My Line?
Fifth graders research their assigned regions, complete regional guide and prepare presentations about the New World colonists. They refer to "Everyday LIfe: Colonial Times" as well as searching marked internet sites.
Curated OER
Cartoon and Political Poster Analysis
Students explore the late 1800s as a time of demographic change in the US. They view the role of media during this time in the form of posters and political cartoons. They create a political poster/cartoon that deals with current...
Curated OER
Surface Friction and Wear Characteristics of Common Materials
High schoolers identify the factors affecting friction. In this physics lesson, students construct their own rocket car and race them. They graph the average speeds and discuss how lubricants affect friction between rubbing surfaces.
Curated OER
What is a Family?
Students explore how Canadian families have evolved over time. In this census results instructional activity, students examine the factors that contribute to changing family and household structures. Students also create written and...
Curated OER
Linear Systems and Calories
Students define and graph properties of linear equations. For this algebra lesson, students write systems of equations to represent functions. They relate linear equations to the real world.
Curated OER
Science in Focus: Force and Motion
Students explore force and motion through a series of experiments. In this physics instructional activity, students create and interpret speed graphs. They build an electromagnet and explain the factors affecting its strength.
Curated OER
Cook Me Up Some Equations
Young scholars study a variety of math concepts in the context of cooking up a meal. In this math lesson, students calculate surface area and volume. They draw and interpret different types of graphs.
Curated OER
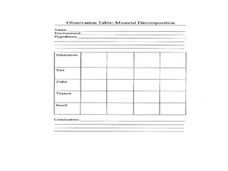
Slow Rot or Not?
Fifth graders examine how environmental factors affect decomposition. In this decomposition lesson plan, 5th graders experiment with the decomposition of grapes in five different environmental settings. They look at images of items that...
Curated OER
Measuring Biodiversity
Young scholars collect species data from a mock intertidal community. In this biology lesson, students graph their data and analyze the species in it. They construct a species accumulation curve and present it to class.
Curated OER
Gaia: The Wisdom of the Earth
Learners are introduced to Gaia theory of natural homeostasis. They graph Earth's temperatures over time, construct terrariums or monitor the outdoor environment. Related videos titles are suggested, but may be outdated. The objectives...
Curated OER
Best Guesser
Fifth graders develop strategies for estimating ages, and illustrate results by graphing and interpreting scatter plots to compare x and y coordinates.
Curated OER
Tech Algebra: A Statistics Study
Students use the internet to gather a minimum of thirty pieces of data. Students create box and whisker graphs, and stem and leaf plots from the information. They calculate mean, median, mode, and range. Students write a summary and...
Curated OER
All in the Family
Students use data to make a tally chart and a line plot. They find the maximum, minimum, range, median, and mode of the data. Following the video portion of the lesson, students will visit a Web site to test their data collection skills...


