Curated OER
Saving Money Through Mathematics
Third graders discuss light sources and collect data about energy sources. They compare data and create a multiple line graph showing energy used by light sources for each student in the group. They present their graphs and write a...
Curated OER
Using Non-Text Features
Second graders examine graphs and charts from their local newspaper. As a class, they discuss what the data means and how it relates to the article. In groups, they are shown two sets of graphs or charts and they practice explaining...
Curated OER
Activity #3 Finding Mass
Students use graph paper to construct a graph and determine the slope of a straight line. They determine the weight (mass) of paper clips with a pan balance. Pupils weigh an unknown number of paper clips, and to interpret the graph to...
Curated OER
Whose Line is it Anyway?
Students solve systems of equations. For this algebra lesson, students identify the domain and range of each function. They use the slope and y-intercept to graph each line.
Curated OER
"Go-Car" Lab
Students construct a car based on directions given. In this physics lesson, students calculate average speed using distance and time information. They collect data and create a graph of distance vs. time.
Curated OER
Discovering Growth Patterns
Students explain the differences between linear (arithmetic) and exponential (geometric) growth. They use worksheets imbedded in this lesson plan to help them make predicitions and graph data points.
Curated OER
Rocketsmania And Slope
Young scholars use a professional basketball team's data and graph it on a coordinate plane. They draw a line of regression and finding its equation. They access a website containing statistics for the Houston Rockets basketball team to...
Curated OER
Finding an Earthquake's Epicenter
Students examine the process used to identify the epicenter of an earthquake. They identify the Richter scale and interpret a seismograph reading. They also view photographs of the aftermath of earthquakes.
Curated OER
Mr. Cobbler's Shoe Dilemma
Pupils employ statistics to solve real-world problems. They collect, organize and describe data. They make inferences based on data analysis. They construct, read, and interpret tables, charts and graphs.
Curated OER
Word Problems
Students solve word problems using mathematical symbols. For this algebra lesson, students collect data and analyze it. They analyze the data using a table or graph after plotting the data.
Curated OER
Mathematical Magazines
Students look through magazines and calculate the percentages of the types of ads in the magazines. In this percentages lesson plan, students create a graph to show their results.
Curated OER
Statistics: Misleading or Accurate?
Students explore the concept of misleading statistics. In this misleading statistics instructional activity, students play a game of tag and graph the number of times each student gets tagged. Students use the graph to determine the...
Curated OER
How Much Will I Spend On Gas?
Students construct a linear graph. In this graphing lesson, students determine a monthly budget for gasoline. Students construct a t-chart and coordinate graph to display data. Resources are provided.
Curated OER
Weather v. Climate
Ninth graders discuss the differences between climate and weather as a class. Using data they collected, they create a graph of the data to share with the class over a specific time period. They compare and contrast this data with...
Curated OER
The football and Braking Distance; Model Data with Quadratic Functions
Students use the quadratic formula to solve application problems. The first problem relates to the path of a football thrown from the top of the bleachers. Students compute the time it will take the football to reach certain heights. In...
Curated OER
Spaghetti Bridges
Eighth graders experiment with building bridges of spaghetti, pennies, and a cup to determine how varying the number of spagetti pieces affects the strength of the bridge. They graph their results and interpret the data.
Curated OER
Choosing a Summer Job
What did you do over your summer vacation. Young wage earners must compare summer job options, and determine when each job earn the same amount and what that amount be. This be done by creating, graphing, and solving systems of...
Curated OER
Real World Systems of Linear Equations
Students solve systems of equations with fluency. For this algebra lesson, students graph, use elimination and substitution to solve systems of equations. They identify the point of intersection using algebra.
Curated OER
Trouble in the Troposphere
Students Use data sets from MY NASA DATA to produce graphs comparing monthly and yearly ozone averages of several U.S. cities. They analyze and evaluate the data and predict trends based on the data. In addition, they discuss and...
Curated OER
Active Wear
Middle schoolers interpret and analyze data. In this middle school mathematics lesson plan, students conduct an experiment in which they investigate which solar collector, black, white, or silver, absorbs the most heat. ...
Curated OER
World War II Review
Ninth graders review previously presented material on World War II and discover how the world was at that time. They, in groups, participate in map work designed to explain Axis and Allied countries using toy army men.
Curated OER
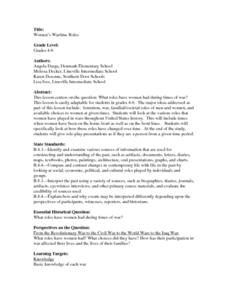
Women's Wartime Roles
Students explore the role of women during times of war. They examine the various roles that women have played in wars throughout United States history and how they have changed over time. In addition, they role-play presentations as if...
Curated OER
Cold Enough?
Students read and record temperatures and display the data. They represent the temperatures on an appropriate graph and explain completely what was done and why it was done. Students display the data showing differences in the daily...
Curated OER
Using Tiles to Solve Word Problems
Students solve problems using equations. In this algebra lesson, students identify the correct symbols and steps when solving word problems. They graph their lines and analyze the slope using tiles.


