Curated OER
Wind Turbines
Students build their own wind turbine. In this physics instructional activity, students calculate the power output of their wind turbines. They evaluate their design and make the necessary modifications.
Curated OER
Pieces of the Past
Seventh graders compare and contrast the way of life of Native Americans in Texas and around the country. As a class, they brainstorm about the uses of pottery today and use broken pieces of pottery to create an artifact. In groups,...
Curated OER
Budgeting 101
Students identify various sources of income and discern between needs and wants as they also learn to create a personal budget. In this personal budget instructional activity, student understand financial scenarios as they relate...
Physics Classroom
The Physics Classroom: 1 D Kinematics: Interpreting Velocity Time Graphs [Pdf]
A printable worksheet for students to practice describing one-dimension motion using velocity-time graphs.
Texas Education Agency
Texas Gateway: Ap Physics: 2.3 Time, Velocity, and Speed
By the end of this section, you will be able to do the following: Explain the relationships between instantaneous velocity, average velocity, instantaneous speed, average speed, displacement, and time; Calculate velocity and speed given...
Other
Socratic: What Is an Acceleration vs Time Graph?
Explains how to construct and interpret an acceleration vs. time graph, and how it would relate to a velocity vs. time graph or a position vs. time graph.
Texas Instruments
Texas Instruments: Match the Graph
In this activity, students walk in front of a calculator-based ranger CBR and try to match a distance-time graph. They examine the rate of change, and analyze and interpret the graph of a function.
CK-12 Foundation
Ck 12: Instantaneous Velocity
[Free Registration/Login may be required to access all resource tools.] Students explore instantaneous velocity and how to calculate it. They also learn how interpret and create position vs time graphs.
Texas Instruments
Texas Instruments: Falling Down Adventure 5
Students use the CBR 2 to study how a change in mass affects the average speed of a falling object. They graph distance as a function of time, and interpret and analyze graphs representing motion.
Science Education Resource Center at Carleton College
Serc: Investigating Motion Graphing Speed
In this introduction to motion activity, students will get a personal understanding of speed and acceleration by experiencing it firsthand. Wheeled office chairs or other cart like devices are used to give one student a ride as a fellow...
Illustrative Mathematics
Illustrative Mathematics: 8.f Bike Race
Eighth graders are presented with the distance-time graphs of two bike riders in a race. They are to identify the winner and write a story describing what is happening during the race based on the shapes of the graphs. Aligns with 8.F.B.5.
Texas Instruments
Texas Instruments: Velocity Test: Interpreting Velocity Graphs
In this activity, students' will use a motion detector to record the distance versus time data for the simple motion of a walker. They will calculate velocity from this graph and compare it with the velocity graph generated by the...
Texas Instruments
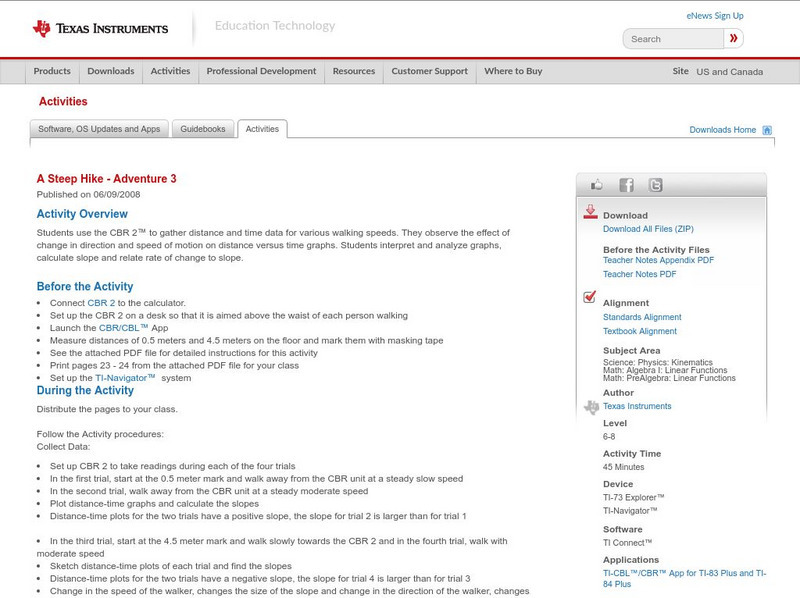
Texas Instruments: A Steep Hike Adventure 3
Students use the CBR 2 to gather distance and time data for various walking speeds. They observe the effect of change in direction and speed of motion on distance versus time graphs. Students interpret and analyze graphs, calculate slope...
Texas Instruments
Texas Instruments: A Sweet Drink Adventure 7
Students determine how the temperature of water affects the dissolving time of a sugar cube. They create, interpret and analyze graphs of data, find an equation of the line of best fit, and relate slope to rate of change.
Illustrative Mathematics
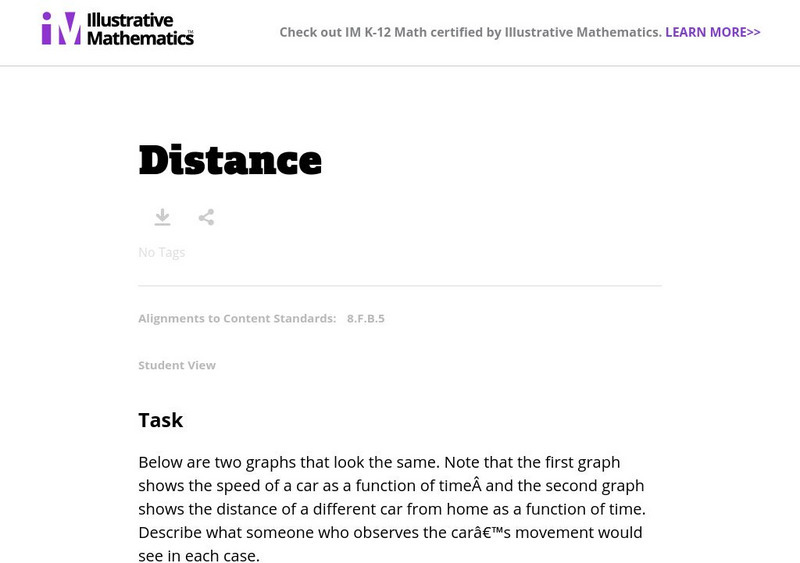
Illustrative Mathematics: 8.f Distance
Eighth graders are presented with the graphs of two cars traveling. One shows distance from home versus time and the other shows speed versus time. Students are to write a description of what might be happening during each car's...
Illustrative Mathematics
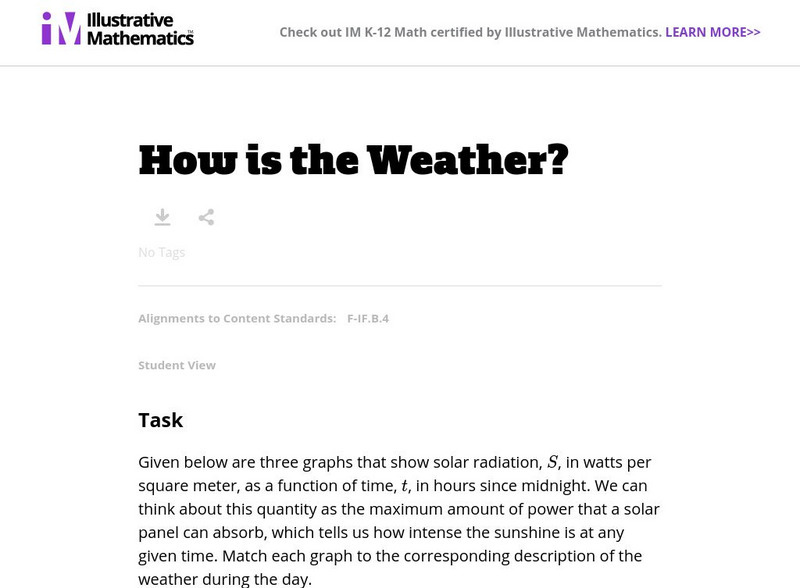
Illustrative Mathematics: F if How Is the Weather?
For this task, students are presented with three graphs that show solar radiation as a function of time. They are asked to match each graph to the corresponding description of the weather during the day. Aligns with F-IF.B.4.
Texas Instruments
Texas Instruments: Animal Skin Adventure 6
In this adventure, students make two models to simulate the cooling rate of different skin surface areas and determine the effect of skin surface area on the results. Students graph temperature as a function of time, interpret, and...
Texas Instruments
Texas Instruments: Buried Objects Adventure 1
Students use the CBR 2 to gather data and identify "buried" objects. They interpret and analyze graphs of height as a function of time, and use the change in the y-coordinates of an ordered pair to determine the height of an object.
Texas Instruments
Texas Instruments: Slippery Slope
In this activity, students will create Distance versus Time plots and calculate the slopes of the plots. They explore the mathematical concept of slopes and understand how slopes can be used to interpret how one physical quantity changes...
TeachEngineering
Teach Engineering: Creepy Silly Putty
Students learn about viscoelastic material behavior, such as strain rate dependence and creep, by using silly putty, an easy-to-make polymer material. They learn how to make silly putty, observe its behavior with different strain rates,...
TeachEngineering
Teach Engineering: Preconditioning Balloons
Students use balloons (a polymer) to explore preconditioning a viscoelastic material behavior that is important to understand when designing biomedical devices. They improve their understanding of preconditioning by measuring the force...
PBS
Pbs: Nova Online: Find Your Longitude
Using Greenwich, England time and longitude of 0 degrees, students determine longitude in this interactive game. Both Shockwave and non-Shockwave versions are available.
Science Education Resource Center at Carleton College
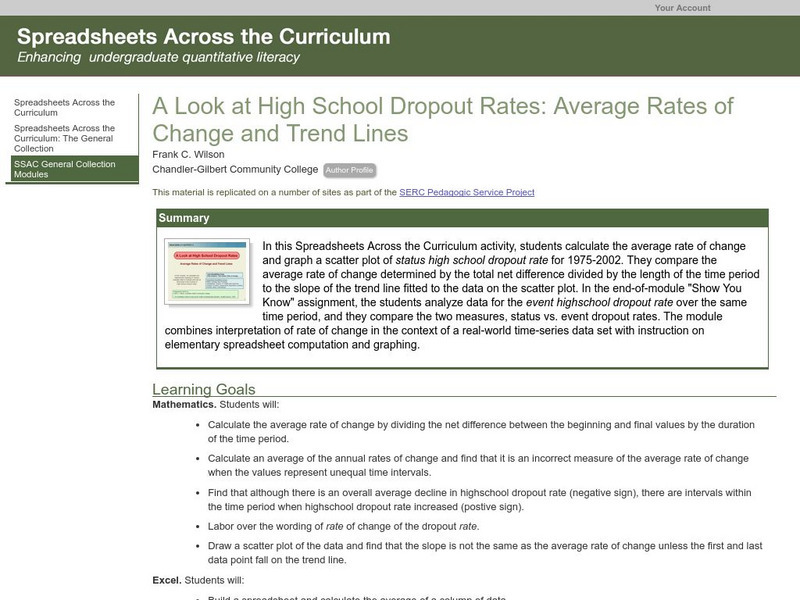
Serc: Average Rates of Change and Trend Lines
In this Spreadsheets Across the Curriculum activity, students calculate the average rate of change and graph a scatter plot of status high school dropout rate for 1975-2002. The module combines interpretation of rate of change in the...
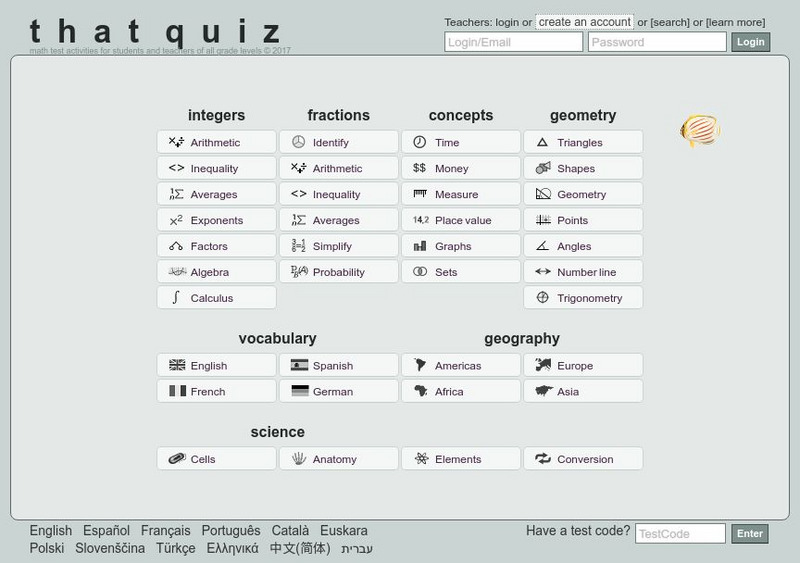
That Quiz
That Quiz
ThatQuiz is an excellent assessment tool for teachers and students. At this site, teachers can create individualized or group assessments on a variety of math topics. Students take these practice assessments directly online and receive...


![The Physics Classroom: 1 D Kinematics: Interpreting Velocity Time Graphs [Pdf] Unknown Type The Physics Classroom: 1 D Kinematics: Interpreting Velocity Time Graphs [Pdf] Unknown Type](https://d15y2dacu3jp90.cloudfront.net/images/attachment_defaults/resource/large/FPO-knovation.png)


