Curated OER
Creating Graphs from Tables
Students interpret data from tables and then create a graph to show the same data in a different organization.
Curated OER
Circle Graphs
Sixth graders interpret, create, and display data in a circle graph. In this circle graph lesson plan, 6th graders use a compass, protractors, pizza boxes, and more to create a circle graph and analyze the data they put into it.
Curated OER
Using Computers to Produce Spreadsheets and Bar Graphs
Students review graphing terminology and how to plot data points, how to input data into a spreadsheet, and how to make a chart using a computer.
Curated OER
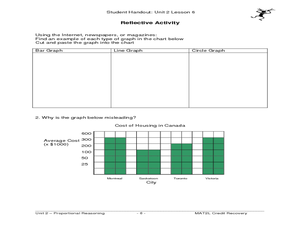
The Circle Graph
For this circle graph worksheet, students complete problems involving many circle graphs including a compass rose, degrees, and more. Students complete 7 activities.
Curated OER
Graphs
Students investigate circle and bar graphs. In this middle school mathematics lesson, students determine which kind of graph is suitable for a given situation and create circle and bar graphs.
Curated OER
Graphing in the Information Age
Middle schoolers create a variety of graphs based on population data. In this statistics lesson, students use data that can be gathered on-line to make a bar chart, line graph, and circle graph.
Curated OER
Graphing Data
First graders learn how to display data using a bar graph. In this bar graph lesson plan, 1st graders use data from a t-shirt color survey to make a bar graph. They also make an animal bar graph before interpreting the information.
Curated OER
Graphing Data Brings Understanding
Students collect, graph and analyze data. For this statistics lesson, students use circle, pie, bar and lines to represent data. They analyze the data and make predictions bases on the scatter plots created.
Curated OER
Temperature Bar Graph
Students explore mean, median and mode. In this math lesson, students analyze temperature data and figure the mean, median, and mode of the data. Students graph the data in a bar graph.
Curated OER
Box and Whiskers
Middle schoolers discover how to relate collected data with a box and whiskers graph in a number of formats. They collect, organize, create, and interpret a box and whiskers graph. Pupils interpret the difference between sets of data,...
Curated OER
Rainbows, Bridges & Weather, Oh My!
Explore how real-world applications can be parabolic in nature and how to find quadratic functions that best fit data. A number of different examples of modeling parabolas are explored including a student scavenger hunt, the exploration...
Curated OER
The Hudson's Ups and Downs
Even rivers have tides. Older elementary schoolers will discuss the Hudson River and how weather, water craft, and the ocean cause tidal fluctuation. They will examine a series of line graphs that depict tidal fluctuation, then analyze...
NTTI
Line 'Em Up!
Coordinate planes and Cartesian graphing systems are the focus of this math lesson. Learners use video, internet activities, and engage in hands-on activities in order to explore coordinate planes. The materials needed for this lesson...
Yummy Math
Diapers
Most of your students probably think a car or college is the first big expense their parents could help them with, but as it turns out these kids have been costing their parents for their whole lives. Have they ever considered how much...
Intel
What Does This Graph Tell You?
What can math say about natural phenomena? The fifth STEM lesson in this project-based learning series asks collaborative groups to choose a phenomenon of interest and design an experiment to simulate the phenomenon. After collecting...
Mathed Up!
Pictograms
Young mathematicians read, interpret, and complete a variety of real-world pictograms. Each question includes a key and information to complete the graphs.
Flipped Math
Modeling with Quadratics
Do some interpretive modeling. Class members watch three examples of interpreting key features of a graph of a quadratic to find solutions to a real-world problem. Learners review how to find the key features on a graph using technology...
Michigan State University
Bug Lyphe!
Introduce ecology classes to biodiversity and interdependence in ecosystems with a PowerPoint presentation. Then, they get up-close and personal with the invertebrate world by collecting insects, classifying them, and graphing their...
Chicago Botanic Garden
Historical Climate Cycles
Ice core samples give scientists access to climates of old—those from more than 800,000 years ago. Through an analysis of various temperature graphs from ice cores, tree rings, and weather stations, scholars compare historical climates...
Curated OER
How Times Have Changed
Fifth graders work in small groups to compile job changes. They use data from the list of changes that the group generated together. Students analyze the data to determine: categories of changes, patterns or trends of changes, and future...
Curated OER
Calculating & Graphing Using a Spreadsheet
Students use the lab apparatus to calculate the average velocity and average acceleration at several points and record the data. They use the spreadsheets to plot distance vs. time, velocity vs. time and acceleration vs. time graphs.
Curated OER
Season Worksheet #5
Sunrise, sunset, swiftly fly the years! Your earth scientists can also fly through a year of daylight data. They analyze a graph and then answer five multiple choice questions about the rising and setting of the sun, the total number of...
Statistics Education Web
Text Messaging is Time Consuming! What Gives?
The more you text, the less you study. Have classes test this hypothesis or another question related to text messages. Using real data, learners use technology to create a scatter plot and calculate a regression line. They create a dot...
Concord Consortium
Cheetah's Lunch
Run like a cheetah. A performance task challenges pupils to solve several different problems involving the speed of a cheetah. Given information for scenarios where the cheetah chases its prey, they determine if the big cat is fast enough.


