EngageNY
Using Tree Diagrams to Represent a Sample Space and to Calculate Probabilities
Cultivate the tree of knowledge using diagrams with two stages. Pupils create small tree diagrams to determine the sample space in compound probability problems. The lesson uses only two decision points to introduce tree diagrams.
Curated OER
Data Analysis, Probability, and Discrete Math
Choose to supplement your probability unit with this resource and you won't be disappointed with the outcome. Teach young mathematicians to organize information using tree diagrams and lists in order to determine the possible outcomes of...
Curated OER
Investigation - Staci's New Car
Students study a shopping problem. They discuss strategies for determining the number of possible choices. They create a tree diagram and an organized list. Students analyze patterns and derive an equation for the multiplication principle.
EngageNY
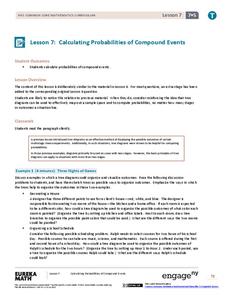
Calculating Probabilities of Compound Events
Use tree diagrams with multiple branches to calculate the probabilities of compound events. Pupils use tree diagrams to find the sample space for probability problems and use them to determine the probability of compound events in the...
Minnesota Department of Natural Resoures
Parts of a Tree
Discover the parts of a tree and so much more with a packet of activities covering a range of subjects. First graders label practice pages, test their measuring and addition skills, explore books, dance, build 3-D trees, play games, give...
Curated OER
Venn Diagram
In this Venn Diagram worksheet, students read a description of a venn diagram and why they are used. Students choose two things to compare and fill in a venn diagram about their similarities and differences.
Curated OER
Money Bags
Third graders explore different combinations of coins that can be used for specified amounts of money using paper money and tree diagrams. They write money amounts in different forms. Groups utilize a tree diagram imbedded in this lesson...
Curated OER
Investigation - Staci's New Car
Sixth graders solve math combination problems. In this combination problem solving lesson plan, 6th graders participate in a teacher led session in which they use tree diagrams and organized lists to determine all of the possible...
Alabama Learning Exchange
Probability with Tree Diagrams
Middle school math whizzes view a PowerPoint tutorial on tree diagrams. Using "Anthonio's Pizza Palace," an interactive activity involving the selection of pizza toppings, they use Pascal's triangle as a tree diagram. This is an engaging...
Curated OER
Drawing Bugs Game
Second graders explore probability by playing a drawing game with dice. After they roll a die, they draw a tree diagram to illustrate each of the possible outcomes.
Curated OER
Combination Factory
Fourth graders use cut-outs of clothing to illustrate the numbers of combinations of articles of clothing they can create. Students create a tree-diagram and count the number of possibilities. They practice showing the information in...
Virginia Department of Education
The Real Meal Deal
Burgers and salads and sodas, oh my! Scholars use a menu to investigate the Fundamental Counting Principle. They create tree diagrams to illustrate the number of possible choices for each given scenario.
Actis
Handling Data: Probability, Tree Diagrams
Clean, but captivating, two online simulations demonstrate probability for middle schoolers. They can choose the number of coins and tosses and watch as the results pile up. They can choose from a variety of spinner types and the number...
Curated OER
Choices! Choices! Choices!
Students explore the Fundamental Counting Principle and tree diagrams. In this secondary mathematics lesson, students choose three pictures of clothing forma a catalog and create as many outfits as possible. Students then use tree...
Shodor Education Foundation
Tree Diagrams and Probability
Aspiring statisticians create tree diagrams and figure probabilities of events based on those diagrams. They practice adding and multiplying fractions and explain complementary probabilities. Students use computers activities to make...
Curated OER
Cyber Combos
Students use lists and tree diagrams to identify possible combinations of objects. They systematically list all possible choices, and predict the number of outcomes using multiplication.
Curated OER
Probabilities for Number Cubes
Students explore the concept of probability. In this probability lesson, students roll a six-sided number cube and record the frequency of each outcome. Students graph their data using a frequency chart and keep tally marks in a...
Curated OER
Grade Data Analysis and Probability
Eighth graders display the outcome of given events by creating and reading tree diagram. They explain the relationship between addition and multiplication.
Curated OER
Algebra II: Fundamental Counting Principal
Students the Fundamental Counting Principal and tree diagrams to determine the total number of choices given sets of data. Using the class roster, they create a tree diagram to identify the number of student groups. Then students apply...
Pennsylvania Department of Education
Adding and Subtracting Rational Numbers to Solve Problems
Students explore the concept of probability. In this probability lesson, students use area to determine probability. Students use charts and spinners to help determine the probability of events such as flipping a coin or rolling a...
Curated OER
Venn Diagram
Students use a Venn diagram to show students' likes and dislikes of eggs and ham.
University of Nottingham
Modeling Conditional Probabilities: 2
Bring the concept of conditional probability alive by allowing your classes to explore different probability scenarios. Many tasks have multiple solutions that encourage students to continue exploring their problems even after a solution...
NY Learns
Investigation - What's in the Bag?
If you have or can create a set of tiles, numbered one through eight, then you can implement this hands-on lesson about probability models. Individuals draw a tile from a bag, record its number, and then return it to the bag. They...
Curated OER
Cyber Chow Combos
Students, after watching the CYBERCHASE episode, "A Day at the Spa,"represent and count combinations of choices using tree diagrams.
Other popular searches
- Combinations Tree Diagram
- Tree Diagram Worksheets
- Tree Diagrams Probability
- Probability and Tree Diagram
- Tree Diagram Probability
- Coin Toss Tree Diagram
- Math Tree Diagrams
- Cocoa Tree Diagram
- Tree Diagrams for Math
- Tree Diagram Activity Sheet
- Branching Tree Diagrams


