Khan Academy
Khan Academy: How the Ad/as Model Incorporates Growth, Unemployment, Inflation
The aggregate demand/aggregate supply, or AD/AS, model is one of the fundamental tools in economics because it provides an overall framework for bringing economic factors together in one diagram. These factors include economic growth,...
US Department of Labor
Bureau of Labor Statistics: Overview of Bls Statistics on Unemployment
The United States Department of Labor provides comprehensive statistics on everything related to unemployment at the state, national, and international levels. Data is available for past years as well.
Khan Academy
Khan Academy: The Phillips Curve in the Keynesian Perspective
Read about how we can use the Keynesian perspective to think about the common tradeoff between low inflation and low unemployment.
Independence Hall Association
U.s. History: The Sickened Economy
The U.S. economy in the 1970s staggered and fell in the 1970s. Read about the reasons for the depressed economy marked by high inflation and high unemployment.
Social Science Education Consortium
Performance of National Economy: How Do We Measure the Economy's Health? [Pdf]
This investigation helps students clarify economic performance measures. These include: percentage changes in the Gross Domestic Product or the Consumer Price Index, how the labor force is measured, the meaning of employment and...
Curated OER
Spending and Output Strings
In this classroom activity, "output" cards and "spending" cards are placed on a string. As each increase or decrease, the economy faces more unemployment or inflation. A good visual device to study the relationships among output,...
Curated OER
Spending and Output Strings
In this classroom activity, "output" cards and "spending" cards are placed on a string. As each increase or decrease, the economy faces more unemployment or inflation. A good visual device to study the relationships among output,...
Curated OER
Spending and Output Strings
In this classroom activity, "output" cards and "spending" cards are placed on a string. As each increase or decrease, the economy faces more unemployment or inflation. A good visual device to study the relationships among output,...
Curated OER
Spending and Output Strings
In this classroom activity, "output" cards and "spending" cards are placed on a string. As each increase or decrease, the economy faces more unemployment or inflation. A good visual device to study the relationships among output,...
Curated OER
Spending and Output Strings
In this classroom activity, "output" cards and "spending" cards are placed on a string. As each increase or decrease, the economy faces more unemployment or inflation. A good visual device to study the relationships among output,...
Curated OER
Spending and Output Strings
In this classroom activity, "output" cards and "spending" cards are placed on a string. As each increase or decrease, the economy faces more unemployment or inflation. A good visual device to study the relationships among output,...
Curated OER
Spending and Output Strings
In this classroom activity, "output" cards and "spending" cards are placed on a string. As each increase or decrease, the economy faces more unemployment or inflation. A good visual device to study the relationships among output,...
Khan Academy
Khan Academy: The Phillips Curve: Foundational Concepts
Practice what you know about the Phillips curve model in this four-question exercise.
Khan Academy
Khan Academy: Phillips Curve: Linking Changes in Ad as Model to Phillips Curve
In this exercise, practice using the graphical model of the Phillips curve.
Information Technology Associates
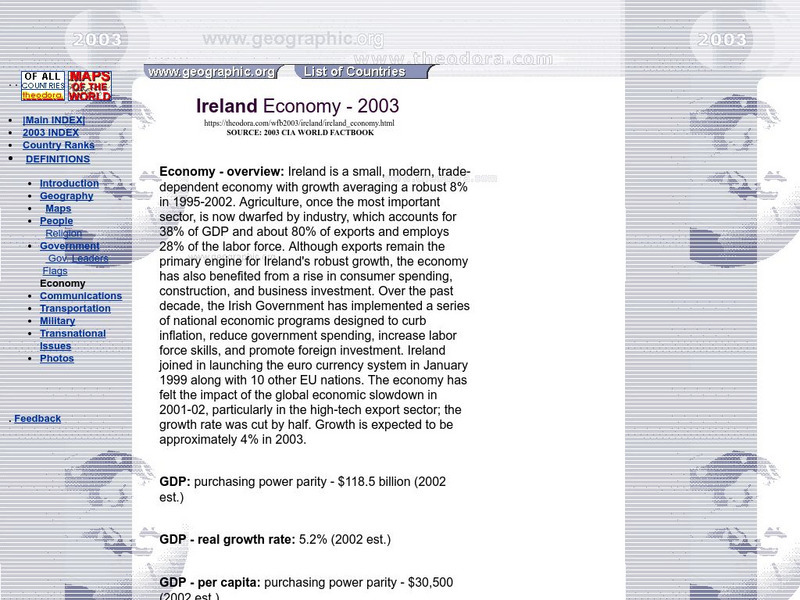
Ireland Economy 2003
A general overview of Ireland's economy from the 2003 CIA World Factbook. Information includes GDP statistics, poverty rates, inflation rate, unemployment rate, budget, major industries, imports and exports, and more.
Central Intelligence Agency
Cia: World Factbook: Luxembourg
Great information about Luxembourg, including the economy.


