Hi, what do you want to do?
Econoclass
Econoclass: Spending and Output Strings
In this classroom activity, "output" cards and "spending" cards are placed on a string. As each increase or decrease, the economy faces more unemployment or inflation. A good visual device to study the relationships among output,...
Khan Academy
Khan Academy: The Phillips Curve in the Keynesian Perspective
Read about how we can use the Keynesian perspective to think about the common tradeoff between low inflation and low unemployment.
Council for Economic Education
Econ Ed Link: It Ain't Where You Start, It's What You Got, and Where You End
This year's federal elections will involve electing a president, all members of the House of Representatives, and one-third of the Senate. Barring some international crisis, economic issues appear likely to dominate the debates. In past...
Khan Academy
Khan Academy: Lesson Summary: Fiscal and Monetary Policy Actions in Short Run
For this lesson summary review and remind yourself of the key terms and graphs related to the effects of fiscal policy actions in the short run. Topics include how fiscal and monetary policy can be used in combination to close output...
Texas Education Agency
Texas Gateway: Ch. 12: The Policy Implications of the Neoclassical Perspective
By the end of this section, you will be able to do the following: Discuss why and how inflation expectations are measured, Analyze the impacts of fiscal policy and monetary policy on aggregate supply and aggregate demand. Explain the...
Texas Education Agency
Texas Gateway: Ch.16: Introduction to Government Budgets and Old Address
In this chapter, you will learn about the following: Government spending; Taxation; Federal deficits and national debt; Using fiscal policy to fight recessions, unemployment, and inflation; Automatic stabilizers; Practical problems with...
Council for Economic Education
Econ Ed Link: Focus on Economic Data: The Inflation Rate
Explore the inflation rate from 2013 through this informative case study. Trace the consumer trends through the graphs and charts on the site.
The Federal Reserve System
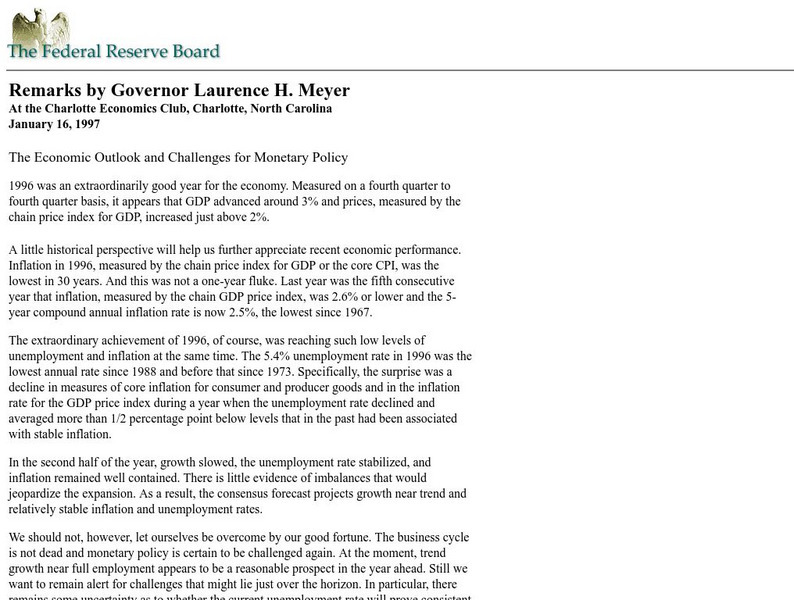
Federal Reserve Board: The Economic Outlook and Challenges for Monetary Policy
A speech given in 1997 which evaluated the economic outlook using the non-accelerating inflation rate of unemployment, or NAIRU, and outlined challenges for monetary policy. (January 16, 1997)
Texas Education Agency
Texas Gateway: Ch. 10: Intro to the Aggregate Demand/aggregate Supply Model
In this chapter, you will learn about the following: Macroeconomic perspectives on demand and supply; Building a model of aggregate supply and aggregate demand, Shifts in aggregate supply; Shifts in aggregate demand; How the aggregate...
Council for Economic Education
Econ Ed Link: Phillips Curve
This lesson explores the relationship of unemployment to inflation in the 1960s and after. Learners will discover the short-run trade-off between inflation and unemployment when unemployment is less than its natural rate. Students will...
Curated OER
Spending and Output Strings
In this classroom activity, "output" cards and "spending" cards are placed on a string. As each increase or decrease, the economy faces more unemployment or inflation. A good visual device to study the relationships among output,...
Curated OER
Spending and Output Strings
In this classroom activity, "output" cards and "spending" cards are placed on a string. As each increase or decrease, the economy faces more unemployment or inflation. A good visual device to study the relationships among output,...
Curated OER
Spending and Output Strings
In this classroom activity, "output" cards and "spending" cards are placed on a string. As each increase or decrease, the economy faces more unemployment or inflation. A good visual device to study the relationships among output,...
Curated OER
Spending and Output Strings
In this classroom activity, "output" cards and "spending" cards are placed on a string. As each increase or decrease, the economy faces more unemployment or inflation. A good visual device to study the relationships among output,...
Curated OER
Spending and Output Strings
In this classroom activity, "output" cards and "spending" cards are placed on a string. As each increase or decrease, the economy faces more unemployment or inflation. A good visual device to study the relationships among output,...
Curated OER
Spending and Output Strings
In this classroom activity, "output" cards and "spending" cards are placed on a string. As each increase or decrease, the economy faces more unemployment or inflation. A good visual device to study the relationships among output,...
Curated OER
Spending and Output Strings
In this classroom activity, "output" cards and "spending" cards are placed on a string. As each increase or decrease, the economy faces more unemployment or inflation. A good visual device to study the relationships among output,...
Independence Hall Association
U.s. History: The Sickened Economy
The U.S. economy in the 1970s staggered and fell in the 1970s. Read about the reasons for the depressed economy marked by high inflation and high unemployment.
Practical Money Skills
Practical Money Skills: Recession
Learn about recessions, periods of economic slowdown often marked by high rates of unemployment, plunging stock prices, lower corporate profitability, and consumer anxiety.
Digital History
Digital History: Reaganomics
This on "Reaganomics," President Reagan's economic policy during his two presidential terms in the 1980s, discusses his laissez-faire approach and tax-cutting, which contributed to the economic recovery of that period.
Khan Academy
Khan Academy: The Phillips Curve Model
This study resource will help students understand, and create, graphs that are critical skills in macroeconomics. This article reviews the Phillips Curve Model. This resource is designed as a review for the AP Macroeconomics Test or a...
Khan Academy
Khan Academy: Lesson Summary: The Phillips Curve
In this lesson summary review and remind yourself of the key terms and graphs related to the Phillips curve. Topics include the the short-run Phillips curve (SRPC), the long-run Phillips curve, and the relationship between the Phillips'...
Social Science Education Consortium
Performance of National Economy: How Do We Measure the Economy's Health? [Pdf]
This investigation helps students clarify economic performance measures. These include: percentage changes in the Gross Domestic Product or the Consumer Price Index, how the labor force is measured, the meaning of employment and...
Texas Education Agency
Texas Gateway: Ch. 14: Pitfalls for Monetary Policy
By the end of this section, you will be able to do the following: Analyze whether monetary policy decisions should be made more democratically; Calculate the velocity of money; Evaluate the central bank's influence on inflation,...


