CNN
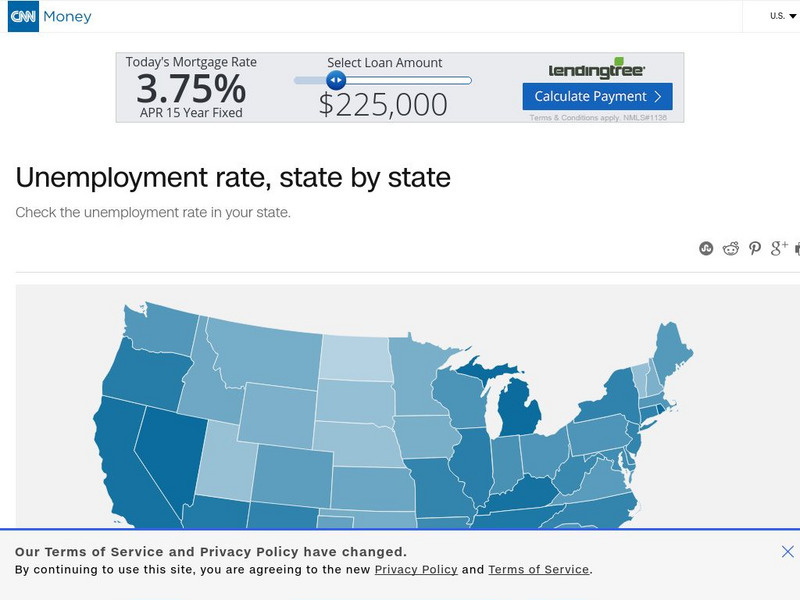
Cnn Money: Unemployment Rate, State by State
Interactive map from CNN showing the current unemployment rate for each state.
Federal Reserve Bank
Federal Reserve Bank of St. Louis: Civilian Unemployment Rate
Provides historical percent, seasonally adjusted, civilian unemployment data for each month from 1948 to the present.
Other
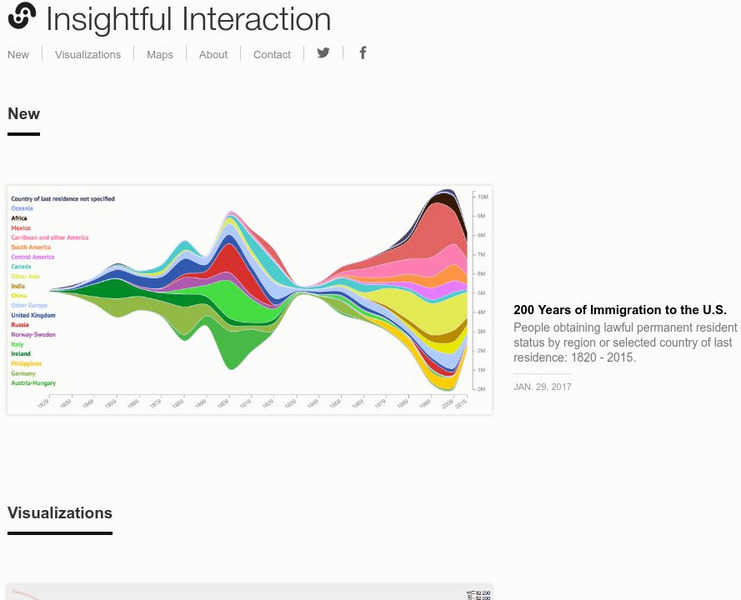
Insightful Interaction: Visualizations
A collection of interactive visualizations that were produced through analysis of economic, political, and market research data. Topics are diverse, e.g., military spending and trade, immigration, consumer spending, crime, unemployment,...
Other
Historical Unemployment Data by Month (1948 2006)
United States unemployment figures for every month from January 1948 to December 2011.


