Statistics Education Web
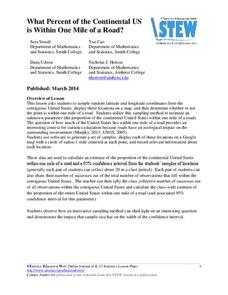
What Percent of the Continental US is Within One Mile of a Road?
There are places in the US where a road cannot be found for miles! The lesson asks learners to use random longitude and latitude coordinates within the US to collect data. They then determine the sample proportion and confidence interval...
Curated OER
US Geography, The Blues
This lesson enables teachers to use blues styles and performers to think about various geographical regions of the United States. By studying different blues styles from the Mississippi Delta, Texas, and the Piedmont region of the...
Curated OER
A Tough Nut to Crack
Sixth graders explore agriculture by examining world geography. In this pecan cultivation lesson, 6th graders identify the history of the famous nut and the impact it has on the U.S. economy, diet and human body. Students define...
Education World
The African American Population in US History
How has the African American population changed over the years? Learners use charts, statistical data, and maps to see how populations in African American communities have changed since the 1860s. Activity modifications are included to...
Curated OER
Agriculture Cares for the World
Students explore world geography by analyzing agriculture. In this dietary habits lesson, students discuss the role parents play in their children's diet and where the food comes from. Students write agricultural research paragraphs and...
Curated OER
N is for Natural State
For any pupils who live in the state of Arkansas, this would be a fabulous educational experience to help them get to know their state better. Through the use of activities in literature, art, mathematics, science, social studies, and...
New York State Education Department
TASC Transition Curriculum: Workshop 11
You'll C-E-R a difference in classroom achievement after using a helpful lesson plan. Designed for economics, civics, government, and US history classes, participants practice using the CER model to craft arguments about primary and...
Curated OER
Massive Migrations
Here is an exciting exploration of a fascinating topic for your emerging ecologists: bird migration! They begin by visiting the US Fish & Wildlife Service website to discover which Arctic birds come to their areas. They are assigned...
Curated OER
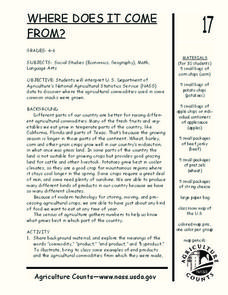
Where Does It Come from?
Students read articles about various agricultural products and create a map using the statistics in the article. In this agricultural statistics lesson, students look at the geography of the country and which products come from the...
Curated OER
Scavenger Hunt for Coins of the World--New Zealand, Japan and France!
Students explore the history, culture and currency of the countries they "visit" using the US Mint Coins of the World activity. Students find the answers to a Scavenger Hunt Questions handout for the country being studied. Students...
Curated OER
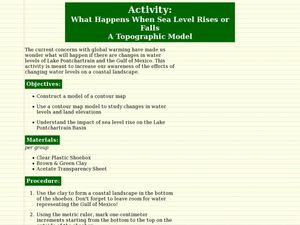
What Happens When Sea Level Rises or Falls
Students examine the impact of sea level on land formations. In this geography and map lesson, students construct a contour map model illustrating how much of the clay "coastline" is covered as water is added. Metric measurement is...
Curated OER
How does Your Province Stack Up?
Learners investigate data about age, and sex of a population. For this statistics lesson, students are given data on a population to analyze and compare to other provinces. This assignment is part of a geography lesson and requires 3...
Curated OER
The Middle-East; Water and Life
Tenth graders examine the physical and cultural impressions made by water in the Middle East, as well as their own lives, through exercises in reading, writing, geography and art. They explore how water as an economic good drives...
Curated OER
Mapping Districts
Students become literate in their use of maps. In this 2010 Census lesson plan, students visualize census data on maps, use map keys to read population maps, and explore the concept of population density.
Curated OER
Riding With Alice
Student listen to Don Brown's, Alice's Grand Adventure before discussing cross country travel. They trace Alice's travels on an outline map of the US and focus on the state of Indiana. They color and label the counties that Alice...
Curated OER
Extreme Elevations
Seventh graders use highest and lowest points of land elevation around the world to find the differences. Sea level is zero, so students be operating with positive and negative numbers. After students find the information on the...
Alabama Learning Exchange
Origami Geometry
Origami is an excellent way to combine Japanese culture, art, and geometric shapes into one engaging instructional activity! Scholars begin by listening to the story Sadako and the Thousand Paper Cranes and learn the origin of...
Curated OER
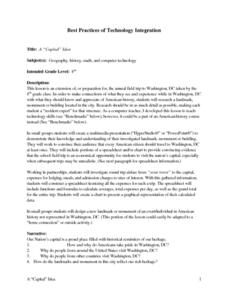
A "Capital" Idea
Eighth graders prepare for a field trip to Washington, DC by researching landmark, monument, or building in Washington. They use the information in small groups to design a multimedia presentation. They include a spreadsheet that shows...
Curated OER
Jr. Chef Club
Students examine the food pyramid. In this health/math lesson students make biscuits. Students are assigned a group to measure out ingredients. Students also discuss which part of the food pyramid biscuits fall into and the nutritional...
Curated OER
In the Wake of Columbus
Students explore how the population decreased in native cultures.
Curated OER
Weather Watchers
Students identify basic weather instruments and how they are used to record weather data. Students define several vocabulary terms as stated in lesson. Students use basic instruments to record weather data in their area. Students use the...
Curated OER
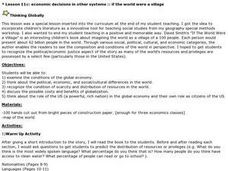
If the World Were a Village...
Your class members explore concept that the world is a large place, examine how statistics can be used to help in understanding the world and its people, and create illustrations or graphs of statistics found in the award-winning...
Curated OER
Vacation Values: A Math WebQuest
Fifth graders participate in a Math Web Quest to research two vacation options for their "families" in order to determine the best mathematical value for their family. They gather data, create two comparison graphs based on that data,...
Curated OER
Statistics Canada
Students practice using graphing tools to make tables, bar charts, scatter graphs, and histograms, using census data. They apply the concept of measures of central tendency, examine the effects of outliers. They also write inferences and...
Other popular searches
- Us Geography Climate
- Us Geography Skills
- Geography Map Skills Us
- Us Geography Pdf
- Us Geography Scavenger Hunt
- Us Geography Northeast
- Us Geography Activity
- Us Geography Slavery
- Us Geography and Economics
- Geography Us
- Us Geography West
- Us Geography Southeast
