Hi, what do you want to do?
Curated OER
Classroom Census
Students take a classroom census. They count in sets, sortan classify groups and ascertain the value of counting.
Curated OER
MONGOLIAN WOMEN - THEN AND NOW
Students are introduced to the history of Mongolia. This is a general overview before going into the real detail of the instructional activity. The main focus is upon the development of the women of Mongolia and the major contributions...
Curated OER
Immigration Push and Pull Factors
Eighth graders examine significant ideas, beliefs, and themes; organize patterns and events; and analyze how individuals and societies have changed over time in Maryland, the United States, and the world.
US Census Bureau
Us Census Bureau: Population Pyramid Graph for Canada
Graphs showing the population pyramids of Canada from the year 2018. Shows a comparison of males versus females.
US Census Bureau
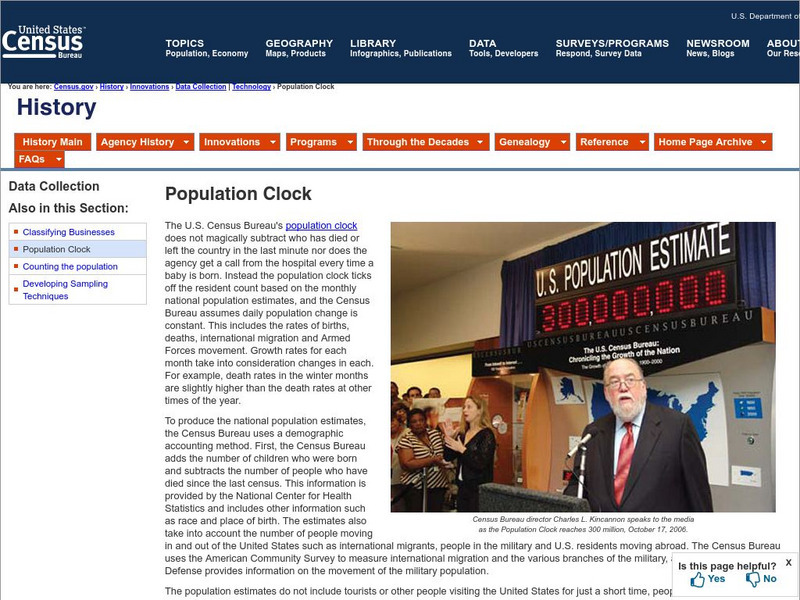
U.s. Census Bureau: Population Clocks
This U.S. Census Bureau Web site has two population clocks with notes available. One clock shows the population increase for the United States. The other shows the world population increase.
Columbia University
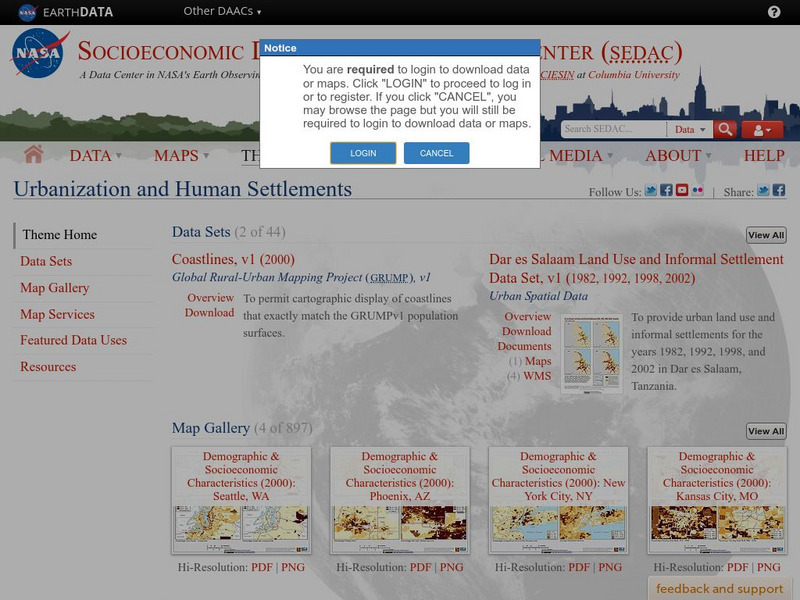
Nasa: Sedac: Urbanization and Human Settlements
[Free Registration/Login Required] A collection of twenty data sets from SEDAC (Socioeconomic Data and Applications Center) that examine urbanization in major metropolitan areas of the United States in the late 20th and the early 21st...
Texas Demographics Center
Office of the State Demographer: Introduction to Migration in Texas [Pdf]
A report explaining the factors that cause a population to increase, as has been the case in Texas, why migration takes place and why it is important, and the contributions of immigrants to Texas. The focus is on population changes...
Other
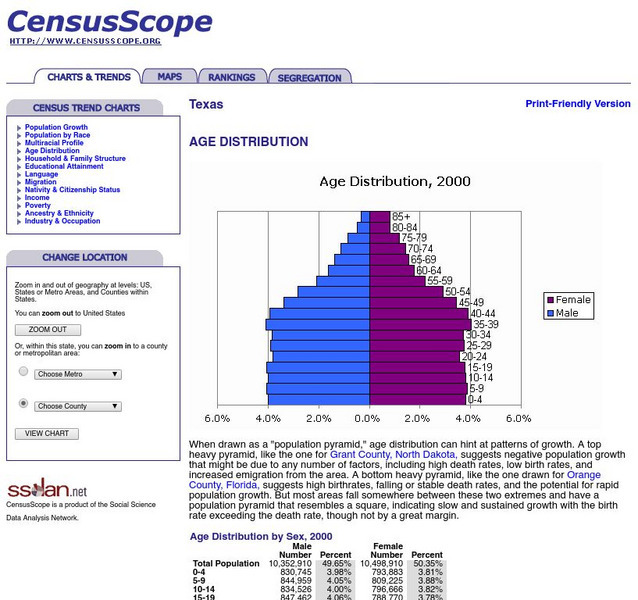
Census Scope: Texas: Age Distribution
Presents charts showing the age distribution by gender of the population of Texas in 1990 and 2000.
Curated OER
Educational Technology Clearinghouse: Maps Etc: Population Distribution, 1870
A map from 1907 of the United States showing the distribution of the population in 1870. The map is keyed to show areas of population with densities ranging from under 2 inhabitants per square mile to 90 and over inhabitants per square...
Curated OER
Educational Technology Clearinghouse: Maps Etc: Population Distribution, 1860
A map of the central and eastern United States in 1860 showing the distribution of the population in the region at the time. The map shows State lines, the frontier line in 1860, and is keyed to show the areas of population density...
Curated OER
Etc: Maps Etc: Distribution of Population , 1850
A map of the United States showing the population distribution in 1850. The map is coded to show population densities ranging from under 2 inhabitants per square mile to over 90 inhabitants per square mile. The map illustrates the...
Curated OER
Etc: Maps Etc: Density of Population in the u.s., 1901
A map from 1901 of the United States showing the population distribution at the time. The map is keyed to show areas of population densities ranging from sparse to very dense. This map is part of a classroom map study illustrating how,...
Columbia University
Nasa: Sedac: Applications of Satellite Remote Sensing
[Free Registration/Login Required] A collection of twenty-eight data sets from SEDAC (Socioeconomic Data and Applications Center) that examine ways in which remote sensing by satellites gives us useful information about the world....
Other
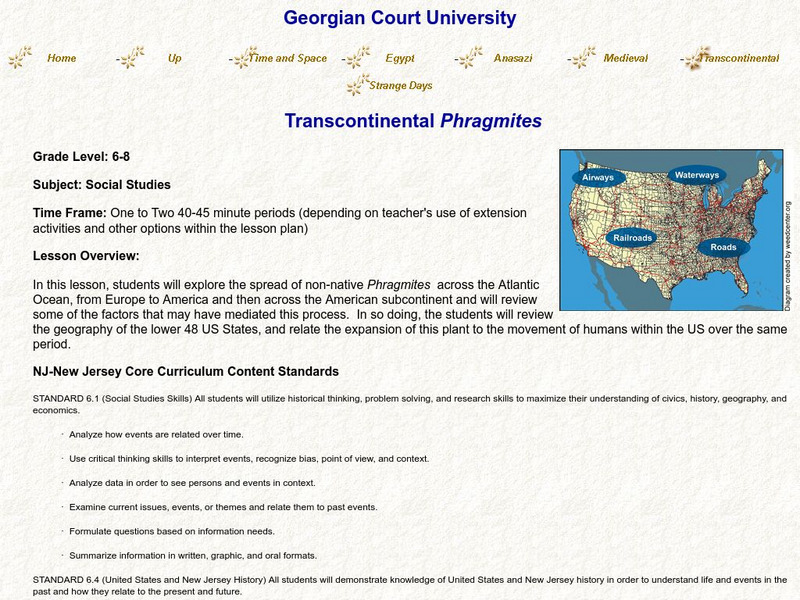
Transcontinental Phragmites
For this activity, students will examine the spread of Phragmites, an invasive species, across the Atlantic from Europe to the United States, and look for connections to human navigation patterns, while applying their knowledge of...
Curated OER
Educational Technology Clearinghouse: Maps Etc: Distribution of Population, 1820
A population map of United States and territories in 1820 showing the distribution of the European-American population at the time and the general tribal lands of the Native Americans east of the Mississippi River. The map shows the...
Curated OER
Educational Technology Clearinghouse: Maps Etc: Distribution of Population, 1830
A population map of United States and territories in 1830 showing the distribution of the European-American population at the time and the general tribal lands of the Native Americans east of the Mississippi River. The map shows the...
Curated OER
Educational Technology Clearinghouse: Maps Etc: Distribution of Population, 1880
A map of the United States showing the distribution of the population in 1880. The map is keyed to show areas of population with densities ranging from under 2 inhabitants per square mile to 90 and over inhabitants per square mile.
Curated OER
Educational Technology Clearinghouse: Maps Etc: Distribution of Population, 1790
A map of the original thirteen States in 1790 showing State lines, territories northwest and south of the Ohio River, British and Spanish possessions, and the distribution of the European-American population east of the Mississippi River...
Curated OER
Etc: Maps Etc: United States Population Density, 1900
A map from 1912 of the United States, subtitled "Distribution of Population and Railways in 1900" showing the increase in population and expansion of the railroad network since 1850. The map is color-coded to show population densities...
Curated OER
Educational Technology Clearinghouse: Maps Etc: American Population, 1790
A map of the original thirteen States in 1790 showing the distribution of the European-American population at the time and the general tribal lands of the Native Americans east of the Mississippi River. The map shows the State lines,...
Curated OER
Etc: Maps Etc: United States Population Density, 1850
A map from 1912 of the United States, subtitled "Distribution of Population and Railways in 1850." The map is color-coded to show population densities ranging from areas with fewer than 2 inhabitants per square mile to areas of 90 or...
Curated OER
Educational Technology Clearinghouse: Maps Etc: Population, 1840
A map of the central and eastern United States in 1840 showing the distribution of the population in the region at the time. The map shows State lines, the frontier line in 1840, and is keyed to show the areas of population density...
Curated OER
Etc: Maps Etc: Population in the United States, 1900
A map from 1910 of the United States showing the distribution of the population in 1900. The map is keyed to show areas of population with densities ranging from under 2 inhabitants per square mile to 90 and over inhabitants per square...


![Office of the State Demographer: Introduction to Migration in Texas [Pdf] Article Office of the State Demographer: Introduction to Migration in Texas [Pdf] Article](http://lessonplanet.com/content/resources/thumbnails/410028/large/bwluav9tywdpy2symdiwmduymc0zmdm4ny1xbnb6bzeuanbn.jpg?1589984930)


