TeachEngineering
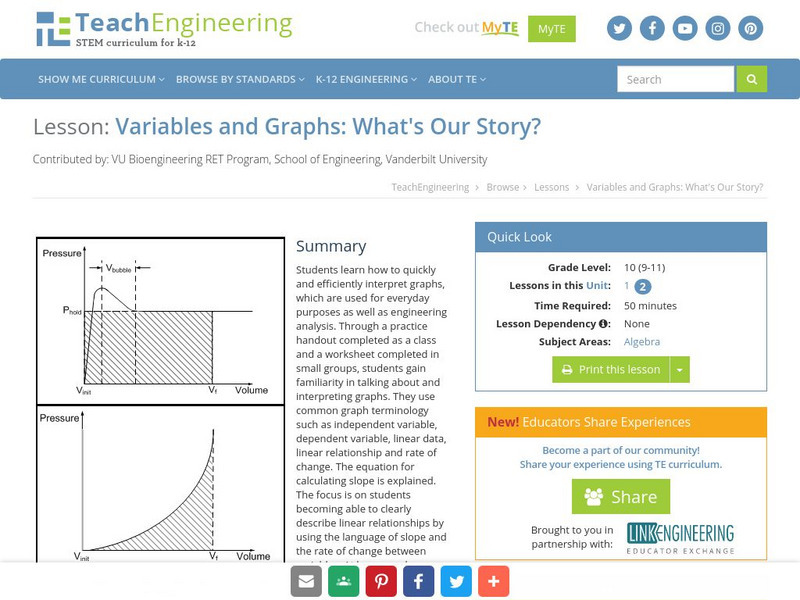
Teach Engineering: Variables and Graphs: What's Our Story?
Students learn how to quickly and efficiently interpret graphs, which are used for everyday purposes as well as engineering analysis.
Primary Resources
Primary Resources: Tally and Bar Charts
Lots of good materials for teaching about tally marks and bar graphs.
Texas Education Agency
Texas Gateway: Evaluating Data in Tables, Graphs and Charts
[Accessible by TX Educators. Free Registration/Login Required] In this lesson students look at examples of graphics, tables, charts, and graphs, and learn how to interpret their data. They will be able to use this skill to enhance their...
Science Education Resource Center at Carleton College
Serc: Investigating Motion Graphing Speed
In this introduction to motion activity, students will get a personal understanding of speed and acceleration by experiencing it firsthand. Wheeled office chairs or other cart like devices are used to give one student a ride as a fellow...
CK-12 Foundation
Ck 12: Statistics: Interpretation of Circle Graphs Grade 7
[Free Registration/Login may be required to access all resource tools.] Interpret circle graphs by using given data.
Other
Nearpod: Construct & Interpret Scatter Plots
For this lesson on scatter plots, 8th graders will learn how to interpret scatter plots and then graph them using a data table.
University of Illinois
University of Illinois: Bar Graphs
Two bar graph examples are shown and explained at this website. You can learn what kind of data is best represented using a bar graph.
PBS
Pbs Teachers: Tree Mendous Plots [Pdf]
To teach students how to use collect and use real-life data, use this lesson to create, populate and analyze graphs to interpret data related to the growth of plants from seeds. The lesson then asks students to create a story about the...
Math Graphs
Houghton Mifflin: Math Graphs: Interpreting a Graph 1 [Pdf]
Students identify or sketch quantities using a given graph. The resource consists of an enlarged printable version of a math graph available in PDF format.
Math Graphs
Houghton Mifflin: Math Graphs: Interpreting a Graph [Pdf]
Students use a given graph to identify and sketch different quantities. The math graph is available in PDF format.
Math Graphs
Houghton Mifflin: Math Graphs: Interpreting a Graph 3 [Pdf]
Students identify or sketch quantities using a given graph. The resource consists of an enlarged printable version of a math graph available in PDF format.
Math Graphs
Houghton Mifflin: Math Graphs: Interpreting a Graph 2 [Pdf]
Students identify or sketch quantities using a given graph. The resource consists of an enlarged printable version of a math graph available in PDF format.
Math Graphs
Houghton Mifflin: Math Graphs: Slope of a Tangent Line 1 [Pdf]
Students use the given graph to estimate the slope of a tangent line. The resource consists of an enlarged printable version of a math graph available in PDF format.
Math Graphs
Houghton Mifflin: Math Graphs: Slope of a Tangent Line 2 [Pdf]
Students use the given graph to estimate the slope of a tangent line. The resource consists of an enlarged printable version of a math graph available in PDF format.
Math Graphs
Houghton Mifflin: Math Graphs: Slope of a Tangent Line 3 [Pdf]
Students use the given graph to estimate the slope of a tangent line. The resource consists of an enlarged printable version of a math graph available in PDF format.
Math Graphs
Houghton Mifflin: Math Graphs: Slope of a Tangent Line 4 [Pdf]
Students use the given graph to estimate the slope of a tangent line. The resource consists of an enlarged printable version of a math graph available in PDF format.
Texas Instruments
Texas Instruments: Velocity Test: Interpreting Velocity Graphs
In this activity, students' will use a motion detector to record the distance versus time data for the simple motion of a walker. They will calculate velocity from this graph and compare it with the velocity graph generated by the...
Science Education Resource Center at Carleton College
Serc: Mass Spectrometry: Using a Game Format to Develop Logic Skills
Students will use previous knowledge of chemistry concepts and skills to interpret mass spectrometry graphs and will learn to determine one or more possible formulas for an organic molecule represented on the graph. They will also gain...
TeachEngineering
Teach Engineering: Using Hooke's Law to Understand Materials
Students explore the response of springs to forces as a way to begin to understand elastic solid behavior. They gain experience in data collection, spring constant calculation, and comparison and interpretation of graphs and material...
Texas Instruments
Texas Instruments: A Steep Hike Adventure 3
Students use the CBR 2 to gather distance and time data for various walking speeds. They observe the effect of change in direction and speed of motion on distance versus time graphs. Students interpret and analyze graphs, calculate slope...
Texas Instruments
Texas Instruments: Slippery Slope
In this activity, students will create Distance versus Time plots and calculate the slopes of the plots. They explore the mathematical concept of slopes and understand how slopes can be used to interpret how one physical quantity changes...
McGraw Hill
Glencoe: Using Graphs to Understand Data Quiz
This is a quiz with five quick questions to check your knowledge of how to use graphs to understand data. It is self-checking.
Math Graphs
Houghton Mifflin: Math Graphs: Average Rate of Change 1 [Pdf]
Students use the graph of "f" to determine the average rate of change and sketch a tangent line. The problem is available in PDF format.
Texas Instruments
Texas Instruments: Falling Down Adventure 5
Students use the CBR 2 to study how a change in mass affects the average speed of a falling object. They graph distance as a function of time, and interpret and analyze graphs representing motion.


![Pbs Teachers: Tree Mendous Plots [Pdf] Lesson Plan Pbs Teachers: Tree Mendous Plots [Pdf] Lesson Plan](https://content.lessonplanet.com/knovation/original/114247-36948766618258b08210c17f84fd1d88.jpg?1661419217)


