The Franklin Institute
Frankin Institute Online: Group Graphing
This site from The Franklin Institute explores how to make a simple graph using a spreadsheet to portray survey data. It also gives a set of interesting sports-related web sites so that students can get statistical inforamtion.
E-learning for Kids
E Learning for Kids: Math: Elephant Plant: Data and Graphs
On this interactive website students practice various math skills using a real-life scenario involving plants. Those skills include interpreting data in a circle graph, interpreting data in a divided bar graph, and interpreting a bar...
CPALMS
Cpalms: Dollars for Density
This is a guided inquiry activity in which students use simple lab procedures and discussions to develop and apply the concept of density. Students collect and graph data which they use to explore the relationship between mass and...
TeachEngineering
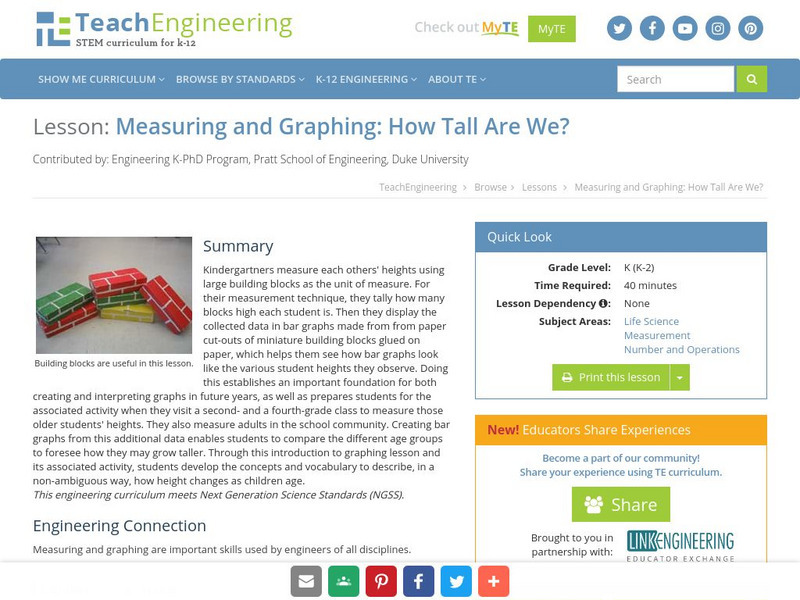
Teach Engineering: How Tall Are We?
Kindergartners measure each other's height using large building blocks, then visit a 2nd and a 4th grade class to measure those students. They can also measure adults in the school community. Results are displayed in age-appropriate bar...
Illustrative Mathematics
Illustrative Mathematics: F Le a Saturating Exponential
For this problem, students use an exponential equation to investigate the warming up of a cold beverage on a summer day and analyze a graph to estimate temperatures. Aligns with F-LE.B.5 and F-BF.B.
Shodor Education Foundation
Shodor Interactivate: Derivate
Explores derivatives and the idea of infinity using a geometric interpretation of slope.
PBS
Pbs Learning Media: Everyday Algebra Plus: Targeted Math Instruction
Algebra lesson focuses on using patterns and relationships to write equations with two variables to represent relationships and patterns in real-world problems, plotting ordered pairs on a coordinate grid, and interpreting the meaning of...
Better Lesson
Better Lesson: Algebra Ii: The Trigonometric Functions
A lesson plan where students will interpret the trigonometric functions in terms of the unit circle, graph a sinusoidal function, and use a sinusoidal function to make interpretations in a modeling context.


