TeachEngineering
Teach Engineering: Growing and Graphing
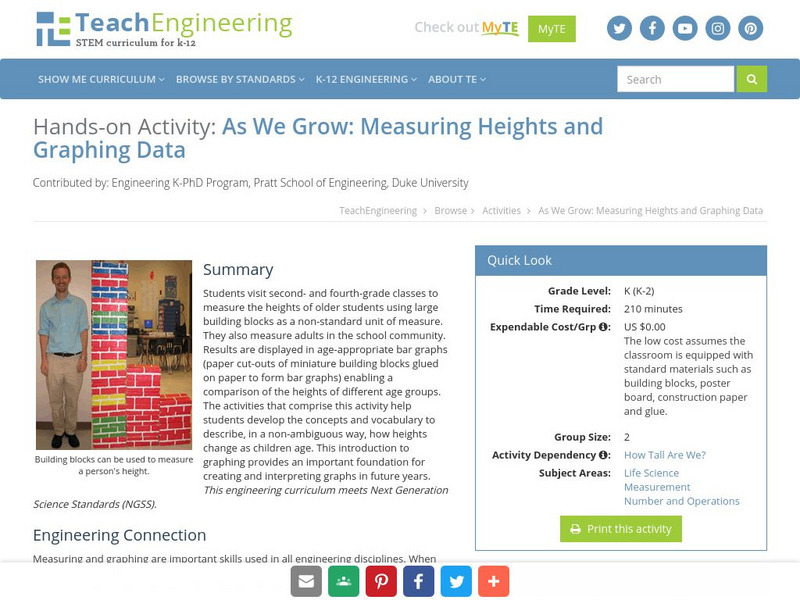
Students visit a 2nd and a 4th grade class to measure the heights of older students using large building blocks as a non-standard unit of measure. They can also measure adults in the school community. Results are displayed in...
Texas Education Agency
Texas Gateway: Appendices: The Use of Mathematics in Principles of Economics
This appendix should be consulted after first reading "Welcome to Economics." Though economics is not math, there is no important concept in this course that cannot be explained without mathematics. That said, math is a tool that can be...
Texas Education Agency
Texas Gateway: Predicting, Finding, and Justifying Data From a Graph
Given data in the form of a graph, the student will use the graph to interpret solutions to problems.
US Geological Survey
Lake Pontchartrain Basin Foundation: Resource Management
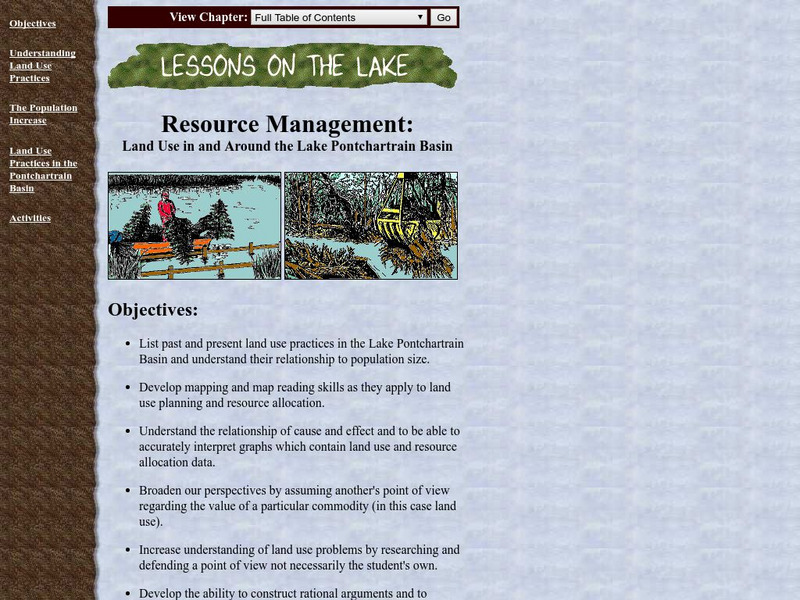
A variety of activities to show students how population size relates to how land is used in the Lake Pontchartrain Basin. Activities provide opportunities for students to interpret graphs, read maps, research problems, defend a side, and...
PBS
Wnet: Thirteen: Math in Basketball: Lesson Plan
In this lesson plan, students will explore ways that mathematics are used in basketball. Students will explore the concept of a function and will learn to use function notation. Students will recognize, describe, and represent quadratic...
Illustrative Mathematics
Illustrative Mathematics: F if Logistic Growth Model, Abstract Version
For this task, students are presented with an equation for a logistic growth model and are asked to analyze it. They are then questioned about a graph showing bacterial population growth. Next, they must use information from earlier...
Read Works
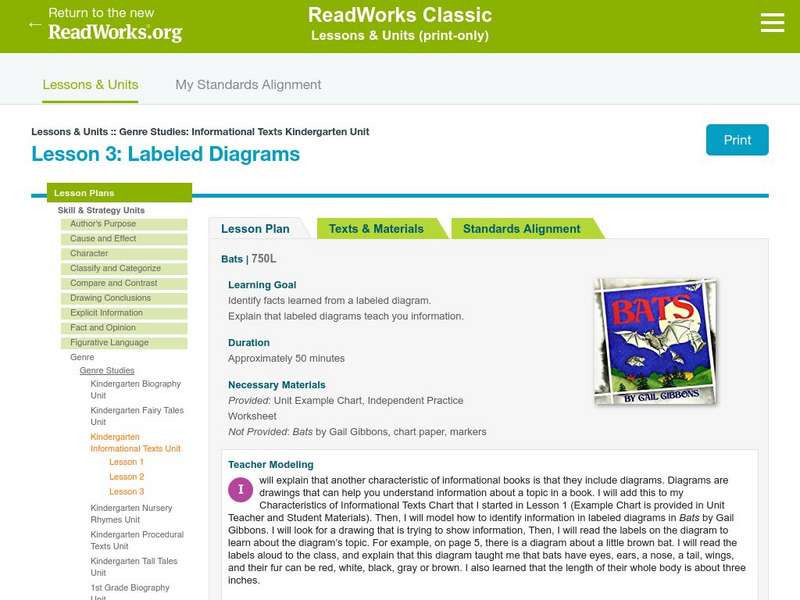
Read Works: Genre Studies: Informational Text Kindergarten Unit: Labeled Diagrams
[Free Registration/Login Required] Lesson uses Bats by Gail Gibbons to teach students how to identify facts learned from labeled diagrams within an informational text. Ideas for direct teaching, guided practice, and independent practice...
Illustrative Mathematics
Illustrative Mathematics: F If.6 Mathemafish Population
For this task, students are presented with a table and a graph and are asked to summarize the data and report the findings of a project by the Environmental Protection Agency to contain the effects of an invasive species on a fish...
Better Lesson
Better Lesson: Algebra Ii: The Trigonometric Functions
A lesson plan where students will interpret the trigonometric functions in terms of the unit circle, graph a sinusoidal function, and use a sinusoidal function to make interpretations in a modeling context.
TeachEngineering
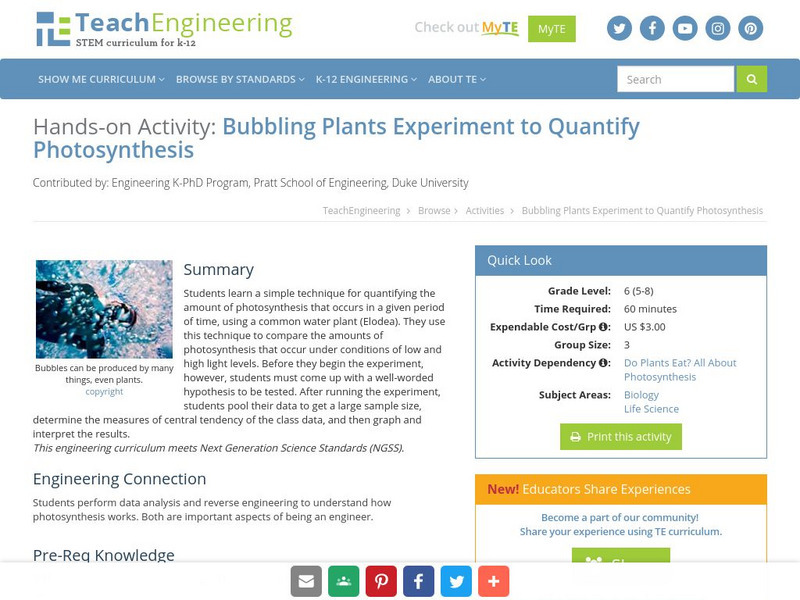
Teach Engineering: Bubbling Plants
Students learn a simple technique for quantifying the amount of photosynthesis that occurs in a given period of time, using a common water plant (Elodea). They can use this technique to compare the amounts of photosynthesis that occur...
Khan Academy
Khan Academy: Lsn 13: Systems of Equations, Algebraic and Graphical Representations
Lesson 3 of 4 for Passport to Advanced Math. Young scholars will solve systems of equations in two variables in which one equation is linear and the other equation is quadratic or another nonlinear equation; relate properties of the...
PBS
Pbs: The Lowdown: Poverty Trends: What Does It Mean to Be Poor in America?
Use math to learn about changes in US wealth distribution and poverty rate over time in this interactive from KQED. In the accompanying classroom activity, students interpret the graphs and consider how the poverty rate spike following...
