Illustrative Mathematics
How is the Weather?
This activity asks learners to interpret data displayed on a graph within the context of the problem. Students are given three graphs that show solar radiation, or intensity of the sun, as a function of time. They are also given three...
Illustrative Mathematics
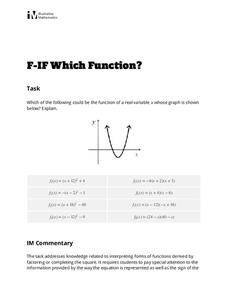
Which Function?
Learners are given a graph of a parabola on a coordinate system, but intercepts and vertex are not labeled. The task is to analyze eight given quadratic functions and determine which ones might possibly be represented by the graph. The...
Curated OER
Linear Inequalities in Two Variables
Use this worksheet as a warm up, a refresher exercise, or a practice after a more detailed lesson on graphing linear inequalities in two variables. Start with boundaries that are horizontal or vertical, then move into graphs with...
Illustrative Mathematics
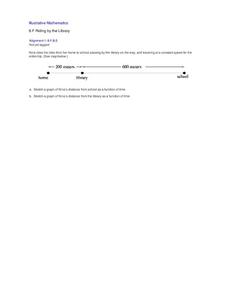
Riding by the Library
Draw a graph that shows the qualitative features of a function that has been described verbally. Make sure learners understand where time is zero and the distance is zero. It may take them some time to understand this concept, so working...
Curated OER
Melting and Freezing of Water
Pupils examine the three states of matter. They identify the segments of heating and cooling curves. Students analyze data and create a graph to determine the freezing and melting temperature of water.
Curated OER
Seasons and Cloud Cover, Are They Related?
Students use NASA satellite data to see cloud cover over Africa. For this seasons lesson students access data and import it into Excel.
Curated OER
Writing Equations in Slope-Intercept Form
Use this worksheet to write equations in both point-slope form and slope-intercept form. Start by writing equations given one point and the slope and finish by writing equations given two points and a few real-world applications. The...
Curated OER
Evidence of Change Near the Arctic Circle
Students analyze graphs and make conclusions about climate change. In this climates lesson students produce graphs and identify relationships between parameters.
Curated OER
Discovering Different Types of Functions
Graph polynomials and identify the end behavior of each polynomial function. The class differentiates between linear, quadratic, and other polynomial equations.
Curated OER
Why Doesn't My New Shirt Fit?
Learners test Leonardo da Vinci's view of the human body by measuring various body parts using a tape measure. They create a data table and a scatter plot and then analyze and interpret the results using a graphing calculator.
Curated OER
Elastic Forces
Third graders predict and experiment to discover the amount of force exerted by a stretched elastic band. They construct a spreadsheet and make a bar graph showing the results of their experiment.
Curated OER
Death by Particles
Emerging epidemiologists define relative risk and read an article about the effect of particulate pollution on the cardiovascular health of women. They record the relative risk values, graph them, and answer analysis questions. This is a...
Curated OER
Volcano Tracking
Students study how to track seismic activity of the Montserrat volcano. They create graphs of the data, study the observation logs that accompany the data, and interpret the graphs in relationship to the logs.
Curated OER
Patterns of Evolution and Selection
Can your young biologists interpret population graphs, match macroevolution patterns and descriptions, and answer multiple choice questions about evolution? Find out with a comprehensive three-page quiz covering some specific examples of...
Curated OER
Inequalities 7.3
Graph inequalities and discuss the difference in their slopes. Learners observe rate of change as they compare linear, quadratic, and cubic functions.
Curated OER
Quilting Geometry
Study geometry through the concept of quilt design. High schoolers examine the geometric shapes in various quilts and then create their own quilts using geometric shapes that fit together. In the end, they write a paragraph to...
Curated OER
Patterns Here, There and Everywhere
Pattern recognition is a skill often used in mathematics. Learners count and sort manipulatives, organize the data into a graph and answer questions about the information displayed. They collect the objects to be used and create patterns...
Curated OER
Sea Changes: A New England Industry
Students conduct research in order to use primary and secondary sources. They interpret and analyze information from textbooks and nonfiction books for young adults, as well as reference materials, audio and media presentations, oral...
Curated OER
Hypothesis Testing
Students investigate the finding of a hypothesis and how it can be tested.For the experiment they will be using the concept of probability. Students design an experiment and test the hypothesis. Then the results are graphed showing the...
Curated OER
Louisville's Best Field Day Park
Students create a survey to hand out to determine the best field day park. Using their local area, they select five parks, if possible, that meet the criteria and calculate the distance and estimated time travel. They use this...
Curated OER
Analyzing the Relationship between Snowpack and River Flow
Students use the Internet to research current and past snowpack levels and river gauging station readings. They determine the relationship between snowpack and river flow. They predict future river flow.
Curated OER
Cover and Boarders
Students find the area and perimeter of rectangular figures. They use this information to find patterns and discover relationships between area and perimeter. Students apply and explain formulas relating to perimeter, area, and volume.
Curated OER
"Can Do!" Reading, Writing, and Understanding the Art of Technical Writing
Technical and informational writing is the most common type of writing that students will encounter. Using this SMART board activity, teach your 10th graders the four different types of technical writing. They can then practice following...
Curated OER
Videobusters
A real-world scenario, Videobusters, a video rental store has just got to get organized. In small groups, the class works on organizing and analyzing data utilizing matrices. They need to use their skills in adding, subtracting and...

