Curated OER
The Great Race
Young scholars identify the mean, median and mode of collected data. In this statistics lesson, students collect, graph and analyze data using central tendencies. They work in groups to collect data on a robot through an obstacle course.
Curated OER
Candy Colors: Figuring the Mean, Median, and Mode
Students count candy by color and then calculate mean, median, and mode. They count candy and use the data to calculate mean, median, and mode (by color) and apply their learning to another collection of data.
Curated OER
Getting A Grip On Graphs
Fourth graders gather variety of data and create a graphs to display the data.
Curated OER
What is a Box and Whisker Plot?
Eighth graders explore the correct use of box and whisker plors. The times when they are appropriate to use to compare data is covered. They plot data according to statistical analysis including mean, median, and mode.
Curated OER
ou are the Researcher!
Students conduct a census at school. They collect data, tally it, and create a frequency table. Students display their data in three different types of graphs. They write complete sentences describing the graph.
Curated OER
Where Should We Put a Store?
Students analyze population data. They convert population data into simple density maps to help make decisions about their world. They select the best location for a school store based on population density. They present their maps...
Curated OER
Discovering Pi
Students develop a formula that describes the functional relationship of the circumference of a circle to its diameter. Working with a partner, they measure the diameter and circumference of circular objects in order to discover the...
Curated OER
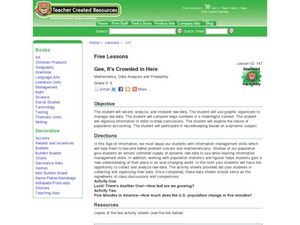
Gee, It's Crowded in Here
Students interpret raw data about population statistics. In this raw data lesson plan, students plug the data into graphic organizers and draw conclusions based on their findings.
Curated OER
Mean, Median and Mode
Fourth graders describe weather data using the mean, median and mode. In this mean, median and mode lesson, 4th graders understand how to calculate data using mean, median and mode and why they would use each one.
Curated OER
Tables, Charts and Graphs
Learners examine a science journal to develop an understanding of graphs in science. In this data analysis lesson, students read an article from the Natural Inquirer and discuss the meaning of the included graph. Learners create a...
Curated OER
Temperature Bar Graph
Students explore mean, median and mode. In this math lesson, students analyze temperature data and figure the mean, median, and mode of the data. Students graph the data in a bar graph.
Curated OER
Float the Boat
Students collect data and analyze it using a graph. In this algebra activity, students identify different bodies of water and relate the flowing to math. They collect data on the rate of flow and the height of flow. They analyze the data...
Curated OER
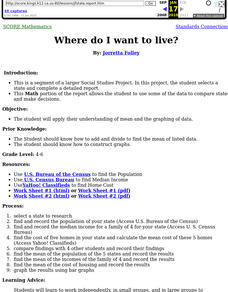
Where Do I Want To Live?
Students use a variety of Internet sources to gather income, population and housing data. Each group bring their results to the class and the class use their findings to compile mean population, income, and housing for all states.
Curated OER
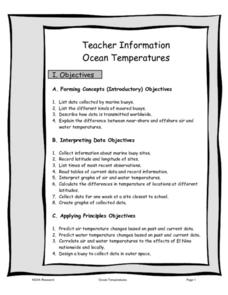
Ocean Temperatures
Learners list data collected by marine buoys and the different kinds of moored buoys. They describe how data is transmitted worldwide. They explain the difference between near shore and offshore air and water temperatures.
Curated OER
Using Maps to Make Public Health Descisions Case Study: Harmful Algal Blooms in the Gulf of Mexico
Learners are introduced to GIS and its uses. Students participate as public health scientists to deliberate a course of action to explore possible research questions. Pupils interpret spatial data, and make predictions based on GIS data,...
Curated OER
Color Tile Graphing
Young scholars explore data. They gather data and generate questions about the data in pictographs, tallies, tables, and bar graphs. Students use color tiles pulled by random to create their own bar graph. They discuss the bar graphs...
Curated OER
Calculating Buttons
Students, after reading "The Button Box" by Margarette S. Reid, analyze real-world data by surveying a sample space. They predict the generalization onto a larger population utilizing calculators and computers. Students total categories,...
Curated OER
Olympic Line Graphs
Sixth graders examine how to make line graphs. In this Olympic line graph lesson students make line graphs and search the given Internet sites to find data on their summer Olympic Game.
Curated OER
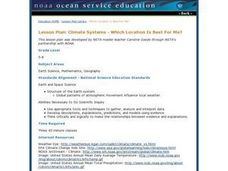
Climate Systems - Which Location Is Best For Me?
Students study the difference between weather and climate. In this climate systems lesson students search the Internet for the parts of the Earth's system, gather climate data and complete a challenge scenario.
Curated OER
Student Heights
Students measure the heights of their fellow classmates and create a box and whisker plot to display the data. In this measurement lesson plan, students analyze the data and record results.
Curated OER
So You Would Like a Wind Farm, Eh?
Students collect and analyze data correctly. In this statistics instructional activity, students use central tendencies to analyze collected data. They calculate where a wind farm will be placed, based on the data.
Curated OER
The Fat and the Lean
Students collect data on calorie intake. In this algebra lesson, students use the collection of data to make better eating decisions. They investigate the nutritional value in food using a graph and draw conclusion from their findings.
Curated OER
Memory Game
Young scholars create cards for a memory game by entering data into a spreadsheet that is then merged into a word processing document. Tutorials are available through links on the lesson page.
Curated OER
Math: Football Fever Fun
Students compile statistics from high school or other football team and construct a spreadsheet on which to record their findings. Using Chart Wizard to analyze the data, they construct charts and graphs for a visual display of the...
Other popular searches
- Collecting and Using Data
- Using Databases
- Using Data to Make Predictions
- Graphing Using Census Data
- Using Data Displays
- Organizing Data Using Tables
- Using a Data Table
- Using a Database
- Using Data Tables
- Record Data Using Tally Marks
- Using Data in Science
- Using Data to Solve Problems


