Oswego City School District
Regents Exam Prep Center: Displaying Data
Use this lesson, practice exercise, and teacher resource in planning instruction on displaying data. In the lessons, you'll find definitions and examples of ways to collect and organize data, quartiles, and box-and-whisker plots, as well...
McGraw Hill
Glencoe: Self Check Quizzes 1 Using Graphs to Make Predictions
Use Glencoe's randomly generated self-checking quiz to test your ability to use graphs to make predictions. Each question has a "Hint" link to help. Choose the correct answer for each problem. At the bottom of the page click the "Check...
E-learning for Kids
E Learning for Kids: Math: Rice Field: Data and Length
On this interactive website students practice various math skills using a real life scenario of a rice field. Those skills include understanding information displayed in column graphs, collecting data to answer a question, and measuring...
National Council of Teachers of Mathematics
Nctm: Illuminations: Histogram Tool
This tool can be used to create a histogram for analyzing the distribution of a data set using data that you enter or using pre-loaded data that you select.
Texas Education Agency
Texas Gateway: Predicting, Finding, and Justifying Data From a Table
Given data in table form, the student will use the data table to interpret solutions to problems.
Web Elements
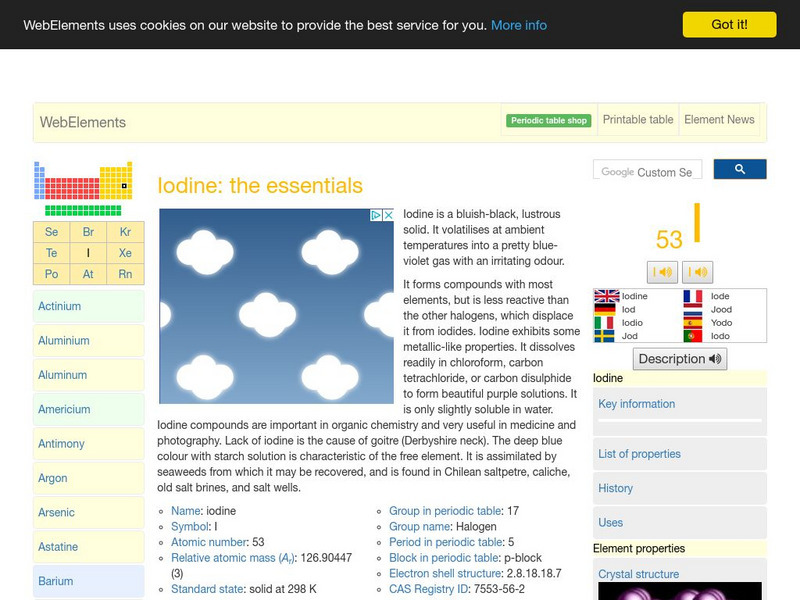
Web Elements Periodic Table: Iodine
A very nice WebElements site with all sorts of basic data on iodine, its chemical and physical properties, isotopes and uses.
Better Lesson
Better Lesson: Using Table Data: Time to the 1/2 Hour
My students have learned how to read and write time. Now I want them to see how important time is for us to organize our lives. I want them to use data charts for schedules and be able to analyze the information.
Better Lesson
Better Lesson: Class Surveys and Graphs
Learners love graphing data that they "own". In this plan, the class will select a type of graph and create it using a class survey frequency table. Included in this activity are videos of the class engaged in the activity and samples of...
Shodor Education Foundation
Shodor Interactivate: Plop It!
PlopIt allows users to build dot plots of data using the mouse. View how the mean, median, and mode change as entries are added to the plot.
CPALMS
Cpalms: Dollars for Density
This is a guided inquiry activity in which students use simple lab procedures and discussions to develop and apply the concept of density. Students collect and graph data which they use to explore the relationship between mass and...
Better Lesson
Better Lesson: Circle Graph Activity
This lesson will allow the student to work through three stations. The stations will focus on creating and analyzing circle graphs. The students will be using technology to create their graphs along with a hands-on activity using M&M's.
Web Elements
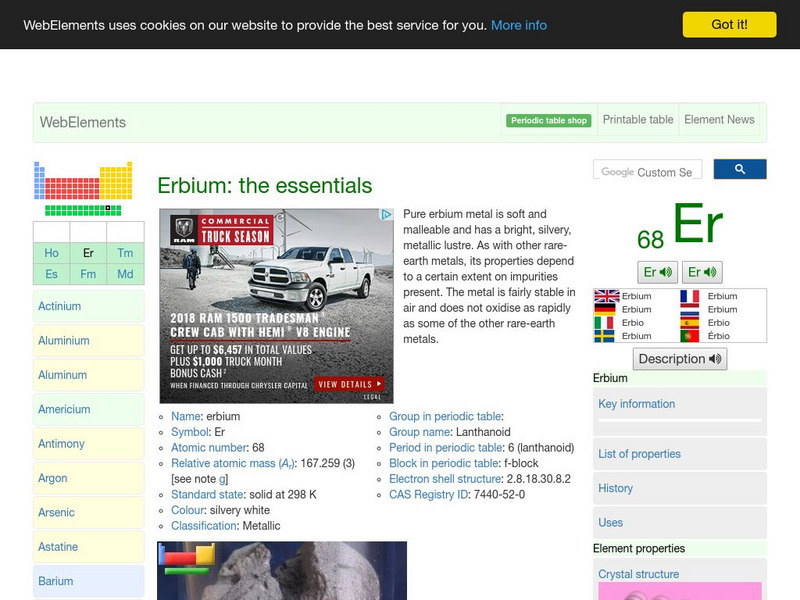
Web Elements Periodic Table: Erbium
Webelements offers a nice presentation on erbium, its properties, uses and history, along with basic data. Clearly presented.
University of North Carolina
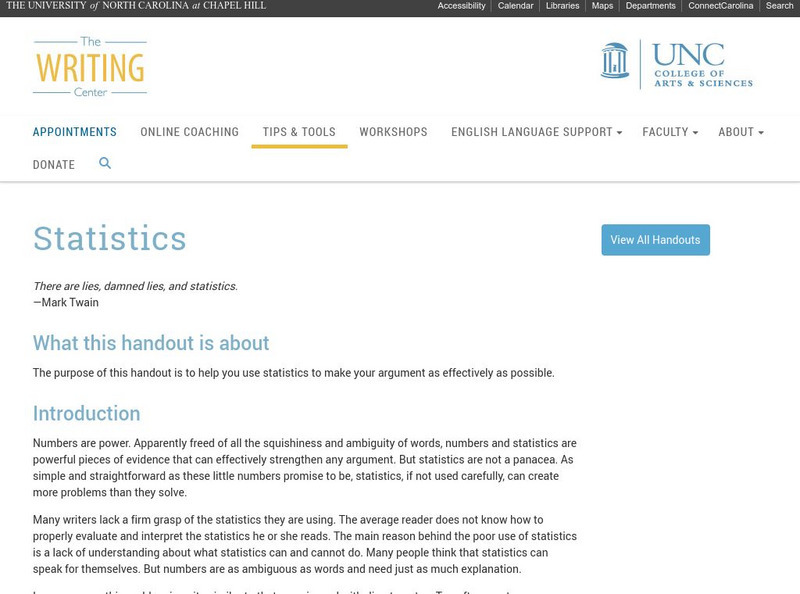
University of North Carolina Writing Center Handouts: Statistics
When presenting an argument, the use of statistics to support a point can be very effective. This handout offers advice on both how to read statistics so that you understand exactly what they mean, and how to use them in your argument so...
Florida-Spectrum Environmental Services
Florida Spectrum: Chemical Fact Sheet: Neptunium
This site provides a fact sheet with information on the basic data and properties of Neptunium. It also includes some of its uses.
Florida-Spectrum Environmental Services
Florida Spectrum: Chemical Fact Sheet: Samarium
This site provides a fact sheet with information on the basic data and properties of Samarium. It also includes some of its uses.
Florida-Spectrum Environmental Services
Florida Spectrum: Chemical Fact Sheet: Sulfur
This site provides a fact sheet with information on the basic data and properties of Sulfur. It also includes some of its uses.
Florida-Spectrum Environmental Services
Florida Spectrum: Chemical Fact Sheet: Scandium
This site provides a fact sheet with information on the basic data and properties of Scandium. It also includes some of its uses.
Florida-Spectrum Environmental Services
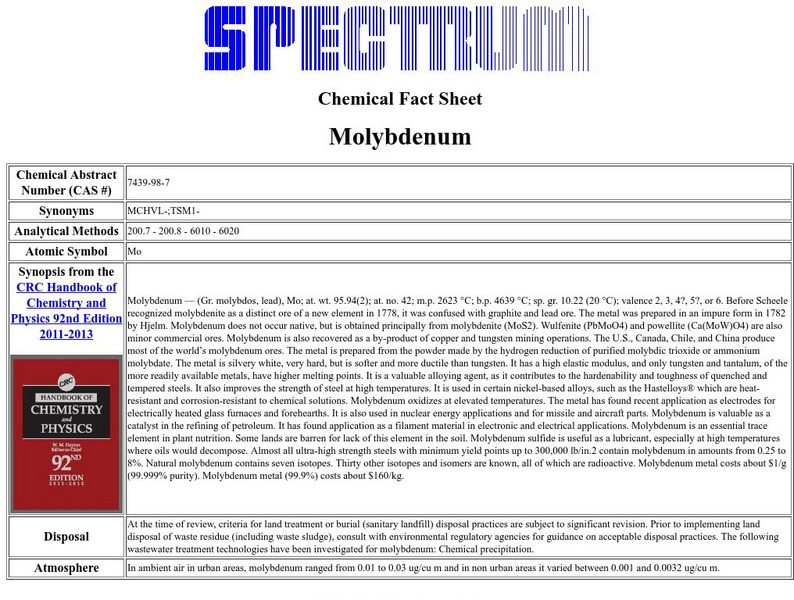
Florida Spectrum: Chemical Fact Sheet: Molybdenum
A great deal of basic data on molybdenum and its properties. There is also lots of information relating to uses and environmental concerns surrounding this metal.
Florida-Spectrum Environmental Services
Florida Spectrum: Chemical Fact Sheet: Antimony
Very thorough assembalage of data on antimony, its properties, uses and sources. Detailed.
Florida-Spectrum Environmental Services
Florida Spectrum: Chemical Fact Sheet: Einsteinium
This site provides a fact sheet with information on the basic data and properties of Einsteinium. It also includes some of its uses.
Florida-Spectrum Environmental Services
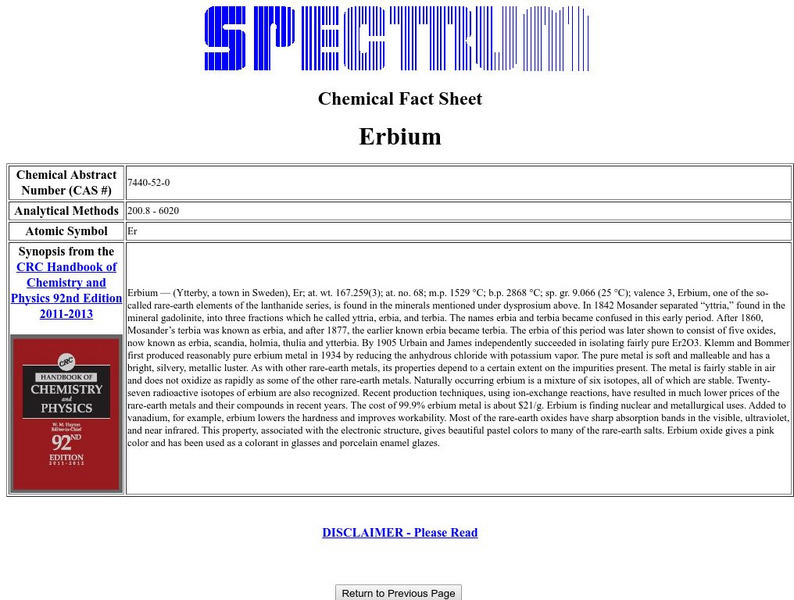
Florida Spectrum: Chemical Fact Sheet: Erbium
This site provides a fact sheet with information on the basic data and properties of Erbium. It also includes some of its uses.
Florida-Spectrum Environmental Services
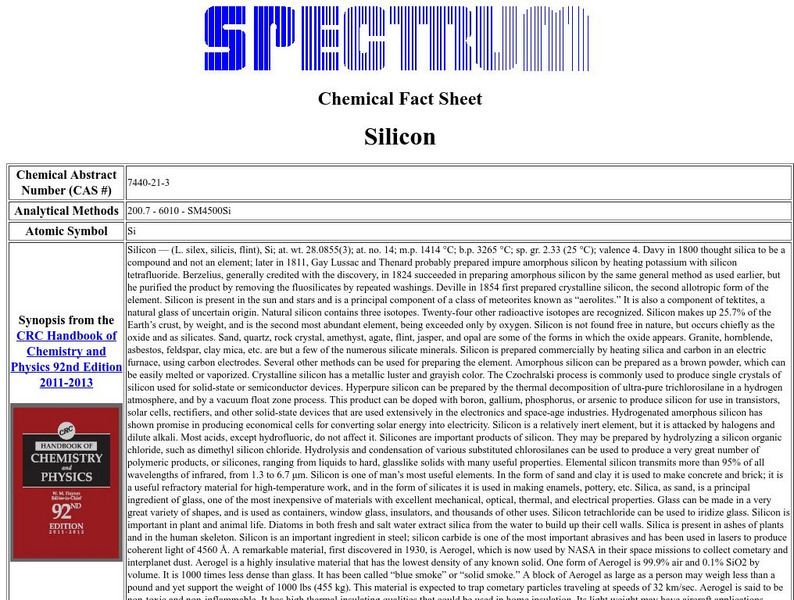
Florida Spectrum: Chemical Fact Sheet: Silicon
This site provides a fact sheet with information on the basic data and properties of Silicon. It also includes some of its uses.
Florida-Spectrum Environmental Services
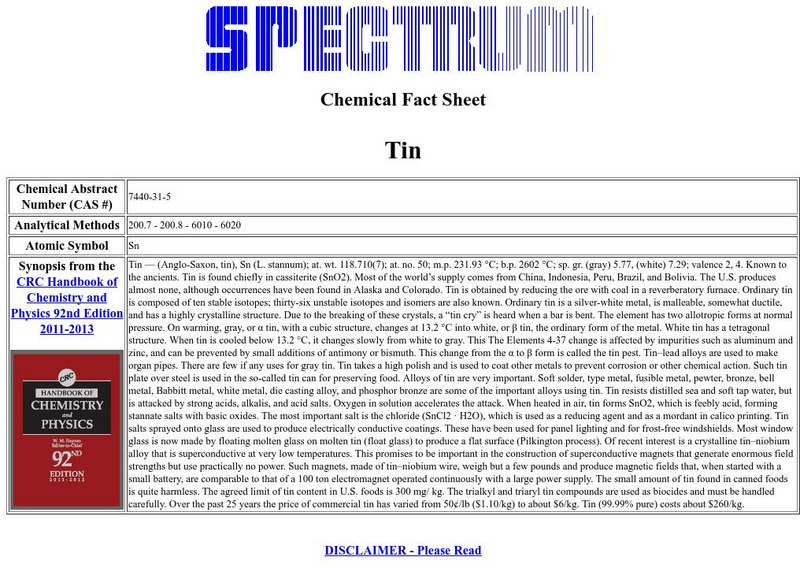
Florida Spectrum: Chemical Fact Sheet: Tin
This site provides a fact sheet with information on the basic data and properties of Tin. It also includes some of its uses.
Florida-Spectrum Environmental Services
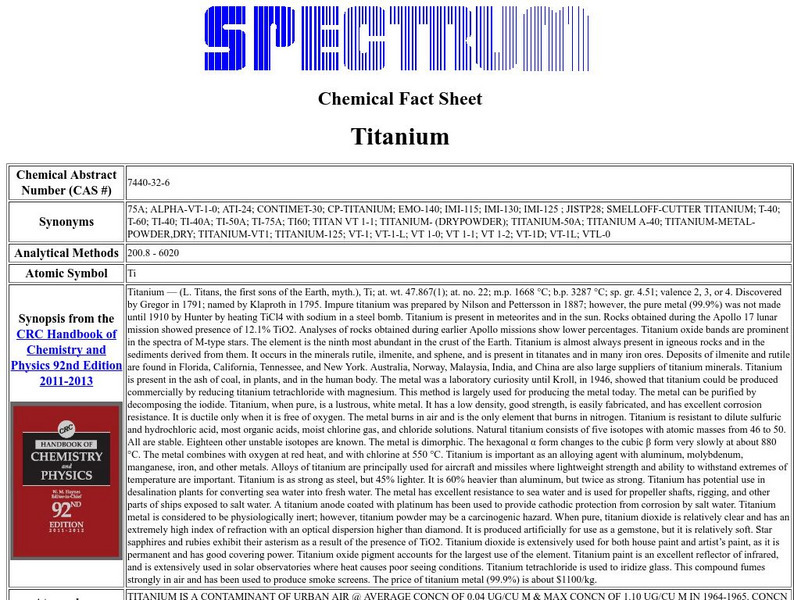
Florida Spectrum: Chemical Fact Sheet: Titanium
This site provides a fact sheet with information on the basic data and properties of Titanium. It also includes some of its uses.


