Hi, what do you want to do?
Texas Education Agency
Texas Gateway: Why Do We Need Data?
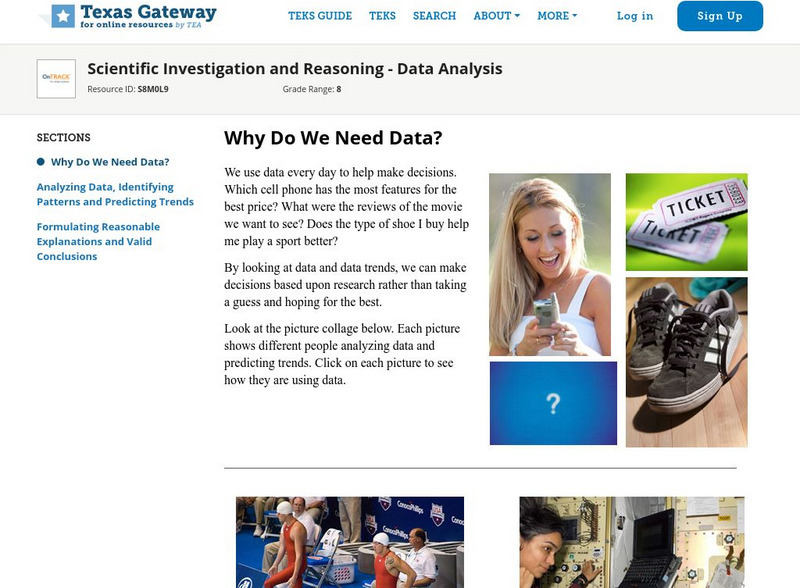
We use data every day to help make decisions. Which cell phone has the most features for the best price? What were the reviews of the movie we want to see? Does the type of shoe I buy help me play a sport better?By looking at data and...
Council for Economic Education
Econ Ed Link: Inflation Data: Is the Economy Healthy? (Grades 9 12)
This lesson asks students to identify sources for macroeconomic data, interpret data, describe the present state of the economy using current data, and use data to predict the state of the economy one year from now.
Center for Innovation in Engineering and Science Education, Stevens Institute of Technology
Ciese Real Time Data Projects: Musical Plates: A Study of Earthquakes
In this project, students use Real-time and volcano data from the Internet to explore the relationship between earthquakes, plate tectonics, and volcanos.
Other
Laus Dnet: Grade 5 Excel Lesson Plan
In this online lesson, students will survey students in their school to determine their favorite type of hand-held ice cream. Before performing the survey, students will make predictions about which ice creams they think will be the...
Code.org
Code Studio: Picturing Data
Use a Play Lab project to collect data and make predictions. Use this unplugged activity to introduce data.
Center for Innovation in Engineering and Science Education, Stevens Institute of Technology
Ciese: Down the Drain Project
Teachers can start this project at any time and no registration is required. Students collect data about water usage for themselves, their homes and their class. They analyze it, make predictions about it, and submit the data to the...
PBS
Pbs Lesson Plan: Chances Are Talking Probability (Pdf) [Pdf]
An introductory lesson in probability for students in grades three to five. The concepts presented in this lesson are interwoven, over time, into a current unit of study. Students examine closely the "language" of probability as used in...
Texas Instruments
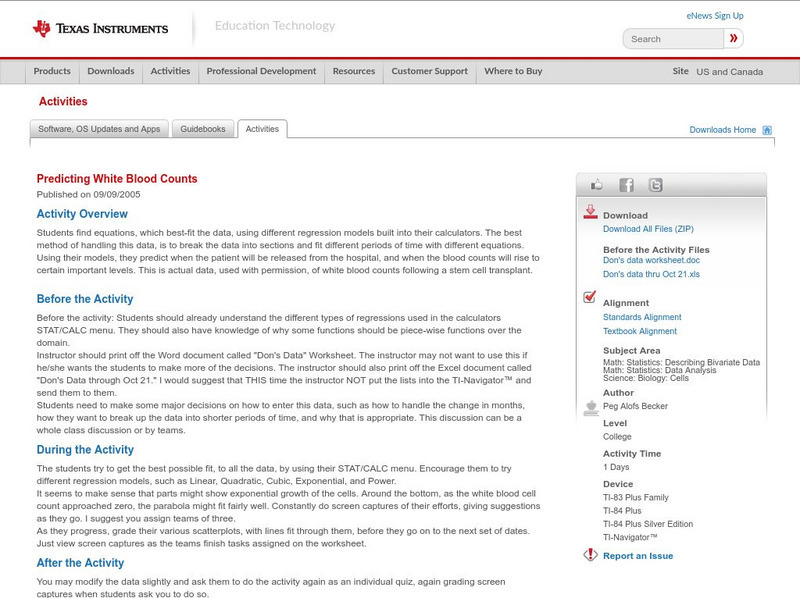
Texas Instruments: Predicting White Blood Counts
Students find equations, which best-fit the data, using different regression models built into their calculators. The best method of handling this data, is to break the data into sections and fit different periods of time with different...
Science Education Resource Center at Carleton College
Serc: Reasoning About Center and Spread: How Do Students Spend Their Time?
Using their own habits for data, young scholars predict how much time they spend on different activities each day, and how much variability each activity is likely to have. They then collect data into a class spreadsheet and look at the...
E-learning for Kids
E Learning for Kids: Math: Music / Dance Performance: Data and Chance Experiments
On this interactive site students use the setting of a dance performance to predict all possible outcomes and make vertical and horizontal bar graphs.
Texas Instruments
Texas Instruments: Math Today for Ti Navigator System Humidity Makes Air Feel
Using data from the USA TODAY graphic "Humidity makes air feel hotter" students will explore linear functions to determine how well they model the relationship between air temperature and heat index. When the model has been determined...
Texas Instruments
Texas Instruments: Math Today for Ti Navigator System Humidity Makes Air Feel
Using data from the USA TODAY graphic,"Humidity makes air feel even hotter," students will explore quadratic and cubic functions to determine how well they model the relationship between air temperature and heat index. When the models...
Texas Instruments
Texas Instruments: Pass the Ball
In this activity, students use mathematics to examine patterns that occur in a specific scenario and predict future events for the scenario. Data is collected on the time it takes to pass a ball. The students plot graphs, fit the data...
Texas Instruments
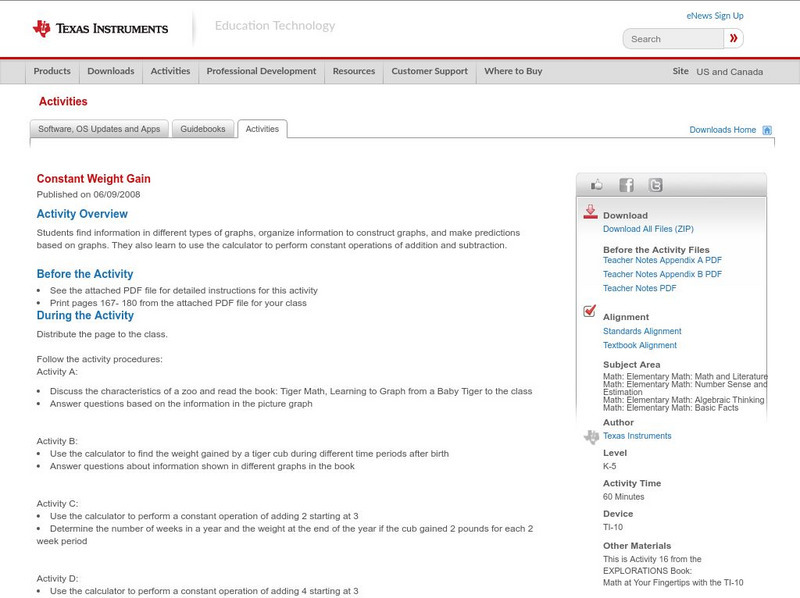
Texas Instruments: Constant Weight Gain
In this activity, students find information in different types of graphs, organize information to construct graphs, and make predictions based on graphs. They also learn to use the calculator to perform constant operations of addition...
Climate Literacy
Clean: Getting to the Core of Climate Change
Students investigate climate changes going back thousands of years by graphing and analyzing ice core data from Greenland and Antarctica. They use information about natural and human-caused changes in the atmosphere to formulate...
Texas Instruments
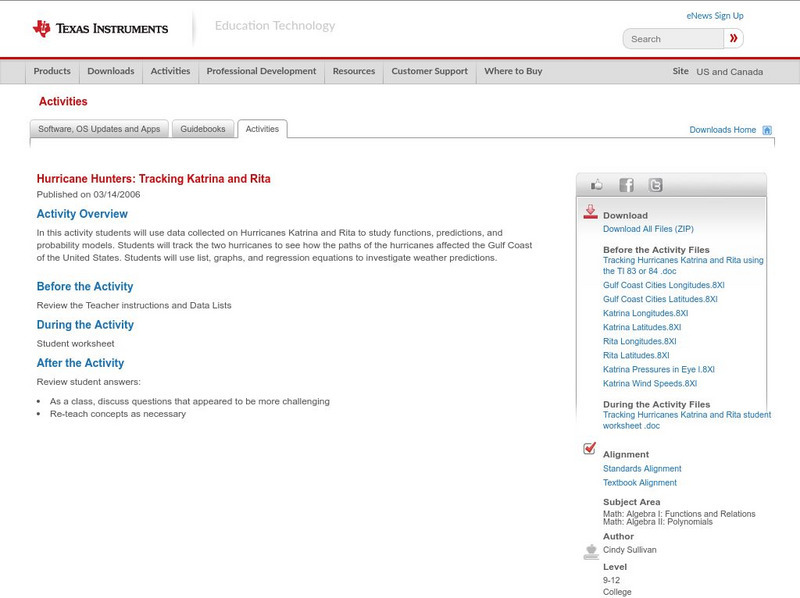
Texas Instruments: Hurricane Hunters: Tracking Katrina and Rita
In this activity students can use data collected on Hurricanes Katrina and Rita to study functions, predictions, and probability models. Students will track the two hurricanes to see how the paths of the hurricanes affected the Gulf...
Texas Instruments
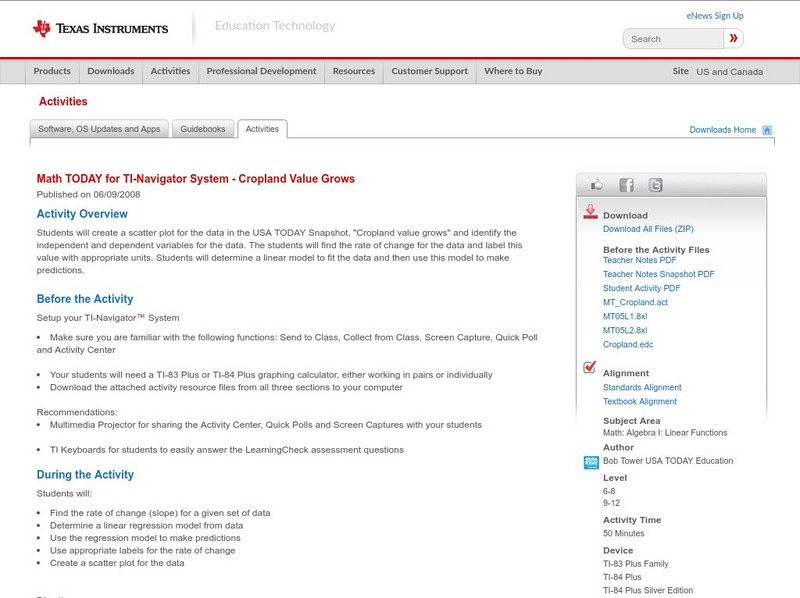
Texas Instruments: Math Today for Ti Navigator System Cropland Value Grows
Students will create a scatter plot for the data in the USA TODAY Snapshot, "Cropland value grows," and identify the independent and dependent variables for the data. The students will find the rate of change for the data and label this...
Texas Instruments
Texas Instruments: Math Today: Red Meat Consumption Continues to Drop
The USA TODAY Snapshot, "Red meat consumption continues to drop," will allow students to work with two sets of data over the same time period. This activity will show how a system of equations can be used to answer questions about the...
Microsoft
Microsoft Education Lesson Plan: Candy Is Dandy
Explore color distribution of M&M candies using this detailed lesson plan. An engaging integrated instructional activity that requires understanding of spreadsheets and formulas, and logical reasoning. Links to related websites.
Texas Instruments
Texas Instruments: Math Today for Ti Navigator System More of u.s.
Using the USA TODAY Snapshot, "More of U.S.," students will learn how to interpret data presented in a graphical form. Students will determine the rate of change (slope) and build a linear model (y = mx + b) from this data. The model...
PBS
Pbs Learning Media: Chances Are
Focus on the "language" of probability by listing events from your life that are certain, impossible, likely and unlikely to happen. Determine the likelihood of an event occurring using a probability scale, based on a data set, and by...
Scholastic
Scholastic: Math Maven's Mysteries: The Case of the Dastardly Disguiser
Famous jewels have been stolen from the Country Music Hall of Fame! The Dastardly Disguiser is a suspect, but we need to find out just how many disguise combinations he can use.
McREL International
Mc Rel: Whelmer #12 Learning Activity: Bernoulli Cans
An easy to do activity that investigates Bernoulli's principle. The activity is presented in lesson plan format that meets NSES standards.
Texas Instruments
Texas Instruments: Muddy Footprints Adventure 11
In this adventure, students will analyze the relationship between height and stride length, and then use that information to identify the biker who left the footprints. They create a scatter plot, find the linear regression equation for...


