US Census Bureau
Us Census Bureau: International Data Base
Statistical data on the population and demographics of 228 countries, including change, sex ratios, life expectancy, and percent with HIV/AIDS. There are also detailed explanations of the means of producing these statistics. It is...
McGraw Hill
Glencoe: Self Check Quizzes 1 Using Graphs to Make Predictions
Use Glencoe's randomly generated self-checking quiz to test your ability to use graphs to make predictions. Each question has a "Hint" link to help. Choose the correct answer for each problem. At the bottom of the page click the "Check...
Alabama Learning Exchange
Alex: Can You Curl Your Tongue?
This lesson is adapted from a Connected Mathematics Unit, How Likely is It? This investigation introduces biology as a source of applications for probability. In this lesson, Curling your Tongue, students determine how many students in...
Texas Education Agency
Texas Gateway: Analyzing Scatterplots
Given a set of data, the student will be able to generate a scatterplot, determine whether the data are linear or non-linear, describe an association between the two variables, and use a trend line to make predictions for data with a...
Science Buddies
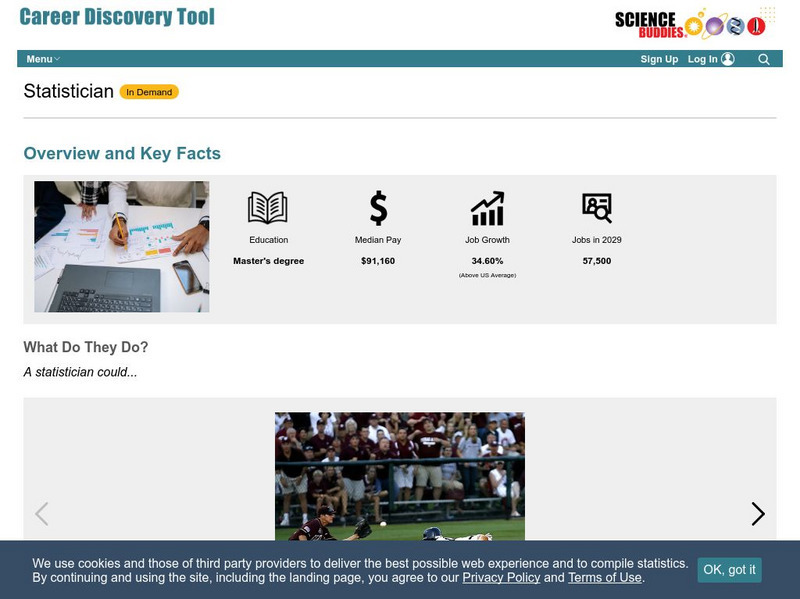
Science Buddies: Career Profile: Statistician
Statistics is a fascinating subject and everyone loves to spout them, but a statistician really knows how to use statistics to answer real-life questions and make predictions based on mathematical data. This Science Buddies site lays out...
Texas Instruments
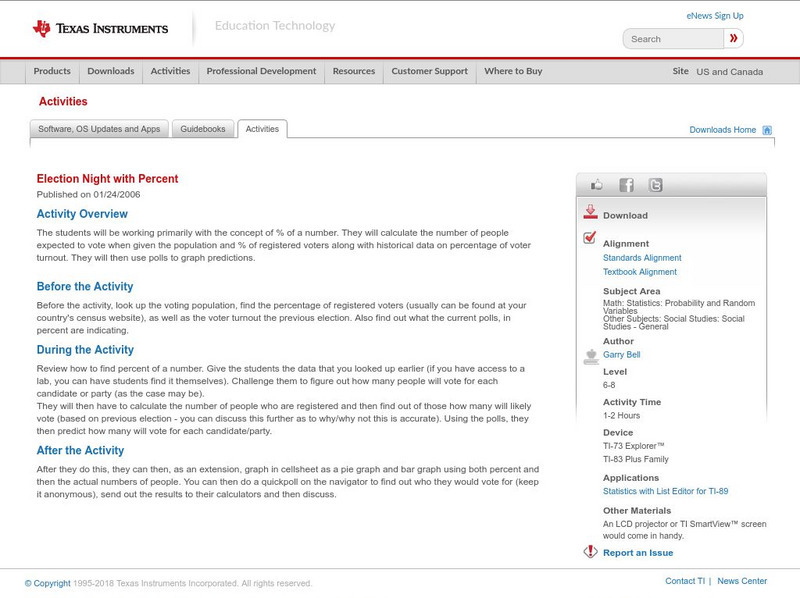
Texas Instruments: Election Night With Percent
The students will be working primarily with the concept of % of a number. They will calculate the number of people expected to vote when given the population and % of registered voters along with historical data on percentage of voter...


