Curated OER
Every Graph Tells A Story
Seventh graders explore linear equations. In this graphing lesson, 7th graders explore constant rates of change. Students discover the real-life application of graphs and demonstrate their ability to read graphs and write corresponding...
Curated OER
Graphing Parabolas
In this graphing parabolas worksheet, 10th graders solve 10 different problems that include graphing various parabolas using the given information. First, they determine the equation of the axis of symmetry for a parabola with a given...
Curated OER
Using Excel to Draw a Best Fit Line
Middle schoolers create line graphs for given data in Microsoft Excel. Students follow step by step instructions on how to create their graph, including how to create a trend line. Middle schoolers print graphs without trend lines and...
Curated OER
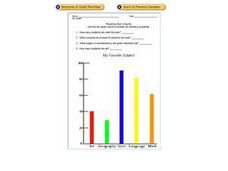
Reading Bar Graphs: My Favorite Subject
In this bar graphs worksheet, students analyze a bar graph about favorite school subjects. Students use the information on the graph to answer 7 questions.
Curated OER
Number lines and graphs
In this number lines and graphs worksheet, students identify points on a number line and in a graph. Students complete 10 multiple choice questions.
Curated OER
Graphing Trash Material
Students investigate data and recyclable materials. In this math lesson, students save recyclable materials and create a graph of the materials. Students discuss how they could help the environment by recycling.
Curated OER
Making Graphs
Young scholars explore statistics by conducting class demographic surveys. In this graph making lesson, students identify the family members of each classmate, pets they own, and favorite activities. Young scholars organize their...
Curated OER
Halloween Graph Paper
In this Halloween graphing learning exercise, 5th graders enhance their math skills by using the graph to help them collect and organize data.
Curated OER
My Test Book: Reading Graphs
In this online interactive math skills worksheet, students solve 10 multiple choice math problems that require them to read and interpret graphs. Students may view the correct answers.
Curated OER
Graphing Linear Equations
Eighth graders examine linear equations by creating graphs from them. In this graphing lesson, 8th graders read several linear equations and plot them on a graph with the help of their classmates. Students find the slope of the linear...
Curated OER
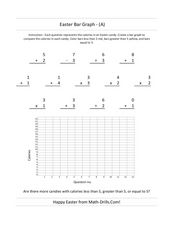
Easter Bar Graph- A
In this Easter math worksheet, students first solve 13 problems with addition, subtraction, multiplication and division. Using the answers, students make a bar graph.
Curated OER
Discovering Magnets and Graphs
Sixth graders investigate averages and statistics by discovering magnet strengths. In this magnet experiment lesson, 6th graders utilize different magnets and attempt to attract different materials to them. Students record the...
Curated OER
Graph Paper 2
In this blank graph paper worksheet, learners use the gridded sections that may be marked off on the x and the y axis as directed by their teachers.
Raytheon
Equations and Graphing Review
In this equations and graphing review instructional activity, learners write, graph and solve equations for 62 problems, including a mid-unit review, with answers included.
Curated OER
Graphing Quadratic Functions
Pupils explore quadratic functions in this algebra lesson. They investigate transformation of quadratic functions using the TI calculator. They use the vertex form for this lesson.
Curated OER
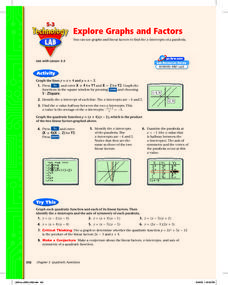
Explore Graphs and Factors
Pupils graph the factors of a quadratic as linear equations and graph the parabolic equation in factored form. Also, they investigate the relationship between the x-intercepts of the lines and the zeros of the parabola.
Curated OER
Making Predictions from Data with a Graphing Calculator
For this making predictions from data worksheet, high schoolers solve 15 short answer problems. Students determine average miles per gallon given data on miles traveled and gas used. High schoolers make predictions using the data and a...
Texas Instruments
Making Predictions Using Systems of Equations
Students explore the concept of systems of equations. In this system of equations lesson, students enter data into lists on their calculators about 100 meter dash times. Students plot the points using a scatter plot and perform a linear...
Raytheon
Graphing: Slope
For this slope worksheet, students complete problems having to do with slope including adding integers, graphing, finding ordered pairs, and more. Students complete 55 problems.
Curated OER
More graphing situations by making a table
Students make a table and graph plotting points. In this algebra lesson, students graph linear equations on a coordinate plane. They calculate the rate of change and analyze the graph for extrapolation.
Curated OER
Using Matrices for Data
In this matrices for data worksheet, 9th graders solve and complete 29 various types of problems that include using matrices to illustrate data. First, they determine the sum, difference and scalar product for each matrices shown. Then,...
Curated OER
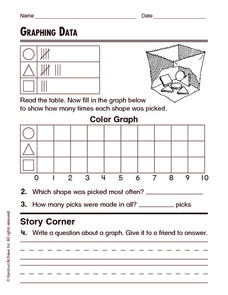
Graphing Data
In this graphing data worksheet, students solve and complete 8 different word problems related to graphing data given. First, they determine the percent of people who do not believe in any of the phenomena described and explain. Then,...
Curated OER
Reflection with a Graphing Calculator
In this transformation worksheet, students reflect a triangle using the list function of a graphing calculator. There are 15 questions.
Other popular searches
- Math Graphs Using M&ms
- Solving Problems Using Graphs
- Using Graphs and Tables
- Predictions Using Graphs
- Report Using Graphs
- Solve Problems Using Graphs
- Estimation Using Graphs
- Problem Solving Using Graphs
- Using Circle Graphs to Display
- Using Graphs to Find Equations
- Bar Graphs Using Excel
- Graphs Using M Icrosoft Excel


