National Association of Geoscience Teachers
Nagt: Bringing the Geologic Time Scale Down to Earth in the Students' Backyard
This activity is specifically designed for a field trip to Drayton Hall, which is a historic plantation near Charleston, South Carolina. It does provide a model of how a similar activity could be designed for a local area, and there are...
National Association of Geoscience Teachers
Quaternary Glacio Fluvial History of the Upper Midwest Using Anaglyph Stereo Maps
Students examine the anaglyph stereo map and use textures to generate a surficial geology map of the Upper Midwest. They can then interpret the textures in terms of landforms, geomorphic features, and earth-surface processes, as well as...
PBS
Pbs Mathline: Blazing the Trail Lesson Plan [Pdf]
Using a scale, determine the distance between landmarks on a map. Printable lesson.
TeachEngineering
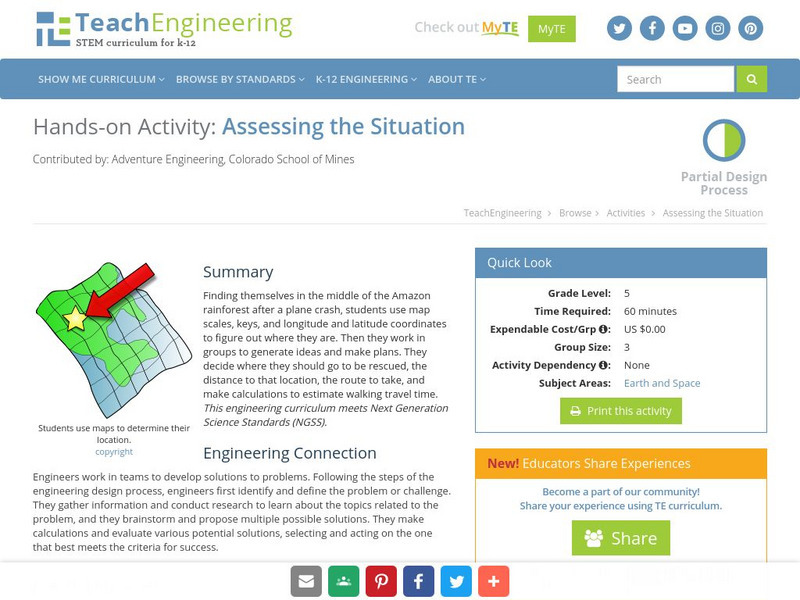
Teach Engineering: Assessing the Situation
In this activity, students will use the scale, the key, and longitude and latitude on a map to determine where they have crashed. They will then use the map scale to determine the distance to the nearest city and how long it will take...
Curated OER
Educational Technology Clearinghouse: Maps Etc: Drawing Asia, 1872
A chart from 1872 illustrating instructions for drawing Asia. "General instructions for drawing the continents. Make a scale by marking on a slip of paper or pasteboard the measures 1,2,3, etc., as on the sides of this map. Every measure...
Curated OER
Educational Technology Clearinghouse: Maps Etc: Asia (Physical), 1901
A map of Asia from 1901 showing the physical features of the region including mountain systems, plateaus, basins, plains, deserts, lakes, rivers, and coastal features and islands. The map shows major ocean currents, the mean annual...
Other
Getting Life in Proportion: Scale and Mapping
In this lesson learners will explore the use of pictures and maps to represent physical spaces. We will explore the concepts of scale and conversions between pictures, maps and real-world units. Conversions between kilometers and miles,...
American Geosciences Institute
American Geosciences Institute: Earth Science Week: Houston Activity: Texas Rocks
Using a geologic time scale and map students investigate the rocks in their area.
Georgia Department of Education
Ga Virtual Learning: Geologic Time and Correlation
In this amazing interactive tutorial you will learn about what methods are used by geologists to learn about the history of the Earth. Investigate a geologic time scale and learn about how scientists have developed and organized a record...
TeachEngineering
Teach Engineering: Hurricane! Saving Lives With Reasoning & Computer Science
Students develop and apply the distance formula and an x-y coordinate plane on a hurricane tracking map, and then use a map scale to determine distance in miles. Then, using MATLAB computer science programming language, students help...
E-learning for Kids
E Learning for Kids: Math: Elephant Plant: Data and Graphs
On this interactive website students practice various math skills using a real-life scenario involving plants. Those skills include interpreting data in a circle graph, interpreting data in a divided bar graph, and interpreting a bar...
TeachEngineering
Teach Engineering: Robotic Perimeter
Students learn and practice how to find the perimeter of a polygonal shape. Using a ruler, they measure model rooms made of construction paper walls. They learn about other tools, such as a robot, that can help them take measurements....
Scholastic
Scholastic: Hunting for States, Capitals, and National Parks! [Pdf]
Students can use a map of the United States to locate state capitals and national parks.
North Central Regional Educational Laboratory
North Central Regional Educational Laboratory: Graphic Organizers
Explanations and diagrams of nine graphic organizers: spider map, series-of-events chain, continuum scale, compare/contrast matrix, problem/solution outline, network tree, human interaction outline, fishbone map, and cycle.
Science Education Resource Center at Carleton College
Serc: Lab 2: What's a Watershed?
Students build a physical model to simulate watershed features, then use Google Earth software to tie the model to a real place. By exploring several layers of map-based images and data, students learn the complexity of a watershed and...
Shodor Education Foundation
Shodor Interactivate: Image Tool
Measure angles, distances, and areas in several different images (choices include maps, aerial photos, and others). A scale feature allows the user to set the scale used for measuring distances and areas.
TeachEngineering
Teach Engineering: Possible Locations
Students use their knowledge of scales and areas to determine the best locations in Alabraska for the underground caverns. They cut out rectangular paper pieces to represent caverns to scale with the maps and place the cut-outs on the...
Alabama Learning Exchange
Alex: Land Surveying Project
This project resulted from of the collaboration of a computer aided drafting teacher, Chris Bond, and a math teacher, Lee Cable, (Hewitt-Trussville High School) to provide higher math expectations in CT and real life application in...


![Pbs Mathline: Blazing the Trail Lesson Plan [Pdf] Lesson Plan Pbs Mathline: Blazing the Trail Lesson Plan [Pdf] Lesson Plan](https://content.lessonplanet.com/knovation/original/114252-32f99d9ad7a7f3ab46350ac7210f4a68.jpg?1661771099)


![Scholastic: Hunting for States, Capitals, and National Parks! [Pdf] Activity Scholastic: Hunting for States, Capitals, and National Parks! [Pdf] Activity](https://content.lessonplanet.com/knovation/original/480522-367e1f79d58efef695e5c826460eaadd.jpg?1661587497)


