Benjamin Franklin Tercentenary
From Ben’s Pen to Our Lives
What would Ben do? Jumping off from the pseudonymous letters Ben Franklin fooled his older brother into publishing when he was still a teenager, young literary lovers dive into acting, writing, and addressing a local issue with wit and...
Curated OER
The Psychology Teacher's Resource Guide
The activities in a comprehensive teacher's resource guide provides budding psychologists with opportunities to design experiments to study behavior, apply their knowledge of research variables, critique online behavior surveys, and much...
Curated OER
Historical Population Changes in the US
Students conduct research on historical population changes in the U.S. They conduct Internet research on the Historical Census Data Browser, create a bar graph and data table using a spreadsheet program, and display and interpret their...
Albert Shanker Institute
Economic Causes of the March on Washington
Money can't buy happiness, but it can put food on the table and pay the bills. The first of a five-lesson unit teaches pupils about the unemployment rate in 1963 and its relationship with the March on Washington. They learn how to create...
Curated OER
Keynesian Equilibrium Without Government
In this Keynesian worksheet, students complete a table, plot functions on a graph, answer questions, solve problems, and make predictions about scenarios with variables.
Curated OER
Water, Water Everywhere?
Learners discover the relationship between water availability and population growth. They change variables in a computer model using a worksheet to guide their hypotheses and conclusions. In small groups they choose a country undergoing...
Museum of Tolerance
Why is This True?
Are wages based on race? On gender? Class members research wages for workers according to race and gender, create graphs and charts of their data, and compute differences by percentages. They then share their findings with adults and...
Council for Economic Education
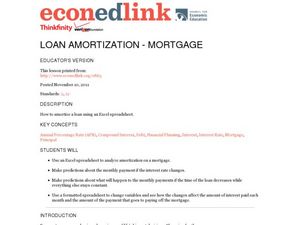
Loan Amortization - Mortgage
When you buy a home for $100,000, you pay $100,000—right? On the list of important things for individuals to understand, the lesson presents the concept of interest rates and loan amortization using spreadsheets and online sources....
Curated OER
Population Density
Students use the scientific method to conduct an experiment and use varied methods to gather background information. They correctly use lab equipment and prepare tables and graphs that organize, conclude, and present their findings. ...
Curated OER
Checking County Numbers
Students use their county's information page to gather information about their community. Using the information, they create graphs from the tables provided and interpret the data. They write a paragraph showing their interpretation of...
Curated OER
Do I Have What it Takes to be an Entrepreneur - and is My Community Ready?
Discover the attributes of entrepreneurs and define what entrepreneurship is while examining data based on local businesses. Learners determine whether their community is supportive of entrepreneurs as they research economic development...
Curated OER
Loan Amortization - Mortgage
Upper graders explore the connection between interest and principal. They use an amortization schedule to determine the amount of principal paid vs interest on a $100,000 home loan. Fourteen discussion questions and a research-based...
Curated OER
Feasibility Study For a New Business
For this business worksheet, students write out a research study looking at the potential for a new business or the profits of an existing one.
Curated OER
Michigan Virtual Field Trip
Students analyze data from a virtual field trip to Michigan. They conduct Internet research on mileage and travel time between cities, calculate and compare fuel costs, and research and calculate lodging, activities, and meal costs.
Curated OER
Balancing Equations and Using a Pyramid
Sixth graders complete worksheets and make journal entries to interpret mathematical expressions about the pyramids. In this equality by balancing equations lesson, 6th graders participate in groups or by themselves to complete exercises...
Curated OER
Distribution of children living at home
Students use E-STAT to examine demographics. In this social demographics lesson, students use statistical data to determine if a particular family is in need of assistance. Students will discuss social and educational policies and...
Curated OER
Building A Nation
Students build their own nation in groups where they create a name, flag, declaration of independence, form of government, mathematical layout, and more. In this nation lesson plan, students also provide a scale drawing of their nation...
Curated OER
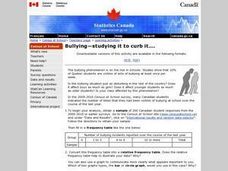
Bullying-studying it to curb it....
Students will engage in a variety of research activities to write what the latest facts are concerning the issue of bullying. This issue is relevant to the lives of learners in schools, which will make for an high interest instructional...
Curated OER
Rent and owner's major payments
Students retrieve and map census data to determine the average rent and owners' payments made throughout Canada. They find out how many people are spending more than 30 percent of their income on housing.
Curated OER
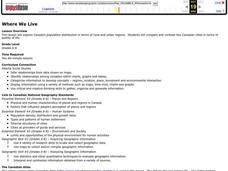
Where We Live
Students analyze Canada's population distribution. They access online information to gather demographic information about two Canadian cities. They compare and contrast the quality of life in the two cities and present their findings.
Curated OER
Mapping the changes in Canada's population
High schoolers find and analyze data found in the census. They compare the population from 1996 to 2001. They explore the type of data they can find in the Census of Population.
Curated OER
Cooperative Group Lesson Plan
Learners work together to develop a city landscape using various symbols. Using the various elements, they justify the placement of each symbol and discover the importance of location and accessibility. They present their landscape to...
Curated OER
Distribution of children living at home
Pupils examine census data to evaluate the number of students of certain ages living at home. This data is then used to determine the need for day care, or other social programs. They use this information to explore social policies.
Curated OER
Social Studies: Canadian City Comparison
Learners research Canadian population distribution while comparing and contrasting the quality of life in two cities. They discuss issues and problems that cities and rural towns face. Students apply various methods, such as graphs and...


