Curated OER
Making and Describing Shapes
Explore the concept of creating and describing 2D and 3D shapes. Using geometry your scholars will describe the attributes of shapes and their properties. They explore and discover what happens when you combine shapes and...
Curated OER
WHAT IS THE POPULAR COLOR?
Fourth graders graph cars according to their colors. They complete the graph including a title, scale, x-axis, and y-axis. Students collect the data and choose the type of graph to be made.
Curated OER
Quilting Geometry
Study geometry through the concept of quilt design. High schoolers examine the geometric shapes in various quilts and then create their own quilts using geometric shapes that fit together. In the end, they write a paragraph to...
Curated OER
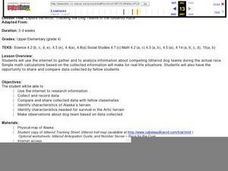
Explore the Arctic: Tracking the Dog Teams in the Ididarod Race
Fourth graders use the Internet to gather and analyze information about competing Iditarod teams during the actual race. They also have the opportunity to share and compare data collected by fellow students.
Curated OER
Property Lists for Quadrilaterals
Students establish classifications of shapes by various properties (angles, sides, etc.). They introduce the important properties of common shapes. Students develop an awareness of the wide variety of ways the 2-D shapes can be alike.
Curated OER
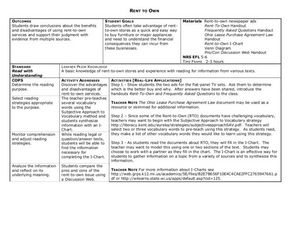
Rent To Own
Reading can be a good way to learn about many different things, like rent-to-own housing programs. Learners read informational resources about rent-to-own programs and how they work. They complete graphic organizers using the facts they...
Curated OER
TE Activity: Cool Views
Students define preservation and conservation before listening to an article read by the teacher about John Muir and Gifford Pinchot, famous environmentalists. They complete a Venn diagram before deciding which side of this environmental...
Curated OER
Pond Theme Unit
In this pond theme activity students research facts on pond life. Students complete comprehension questions, crosswords, word search, and math puzzles. Students write a short report.
Curated OER
Children's Literature Across the Curriculum Ideas-Stone Fox
Learners read and complete a variety of cross-curricular activities surrounding the novel, Stone Fox by John Reynolds Gardiner. Included are reading, math, science, writing, social studies, and library connections. A vocabulary/spelling...
Curated OER
PASS the Arts
Learners explore math and art concepts, create digital art examples of the concepts, and incorporate these works into a PowerPoint portfolio with explanation and analysis.
Curated OER
Teaching in the Shared Way of Ghandi and Montessori
For this differentiated lesson, students incorporate different subjects using the Ghandi and Montessori methods instead of the traditional method used in regular schools. In math they investigate shapes, colors and sizes. In writing they...
Curated OER
A Parade Of Penguins
Second graders complete a variety of penguin-related activities. They discuss and compare different types of penguins, complete worksheets and Venn diagrams, make craft penguins and dioramas.
Curated OER
Deena's Lucky Penny
Students discover the coin denominations of U.S. Currency. In this money lesson, students read the book Deena's Lucky Penny, then complete a coin matching activity using the Internet. Students also read Shel Silverstein's...
Curated OER
Cooking Cranberry Pudding
Students explore colonial cooking. For this cross curriculum George Washington and colonial America history lesson, students follow a recipe for cranberry pudding, a possible favorite of George and Martha Washington. Students...
Curated OER
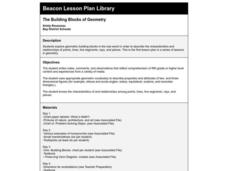
The Building Blocks of Geometry
Fifth graders explore geometric building blocks in the real world in order to describe the characteristics and relationships of points, lines, line segments, rays, and planes. This is the first lesson plan in a series of lessons in...
Curated OER
Excel temperature Graphs
Students gather data about the weather in Nome, Alaska. In this Nome Temperature lesson, students create an excel graph to explore the weather trends in Nome. Students will find the average weather and add a trend line to their graph.
Curated OER
Angle Exploration and Classification
Students compare and contrast angles and identify them as acute, obtuse, right, or straight angles. They create rays and angles using uncooked spaghetti, read and discuss key vocabulary terms, and complete a variety of geometry worksheets.
Curated OER
Blood Types
In this algebra instructional activity, students examine the 4 different blood types, and make a graph deciding which blood types are compatible with each other when it comes to donors. There are 9 questions with an answer key.
Curated OER
One, Two, Three...and They're Off
Students make origami frogs to race. After the race they measure the distance raced, collect the data, enter it into a chart. They then find the mean, median, and mode of the data. Next, students enter this data into Excel at which time...
Alabama Learning Exchange
The Grouchy Ladybug
Students listen to the book, "The Grouchy Ladybug" by Eric Carle and sequence the events in the story. Using a graph, they draw and color the animals that the ladybug meets next to the corresponding time from the story, and conduct...
Curated OER
Where Do I Fit on the Graph?
Young scholars collect data and create graphs about themselves, their community, and the world around them. They use a variety of methods to organize data, such as stickers, clothespins, name tags, coloring, tally marks, etc.
Curated OER
Polluting the Environment
Fourth graders construct mini-ecosystem, pollute the ecosystem, observe, collect, and record data on the effects of these pollutants on their ecosystem, organize data on spreadsheets, create graphs, and design presentations to share with...
Curated OER
Roll or Slide?
Students explore models of three-dimensional shapes. In this geometric shapes instructional activity, students use hands-on manipulatives to explore three-dimensional shapes. Students predict whether each shape will roll or slide.
Curated OER
Away We Go!
Students study types of transportation. In this transportation lesson, students survey several classes to gather data on how they get to school. Students create a transportation graph.
Other popular searches
- Venn Diagram Math Worksheets
- Math + Venn Diagram
- Math Venn Diagrams
- Graphing Math Venn Diagrams
- Sorting Math Venn Diagrams
- Math Venn Diagrams Shape
- Venn Diagrams Math Fractions
- Sets Venn Diagrams Math
- Venn Diagram Math Drawing
- Math Venn Diagram Ms
- Math Venn Diagrams Worksheet
- Venn Diagram Math College


