Curated OER
Away We Go!
Students study types of transportation. In this transportation lesson, students survey several classes to gather data on how they get to school. Students create a transportation graph.
Curated OER
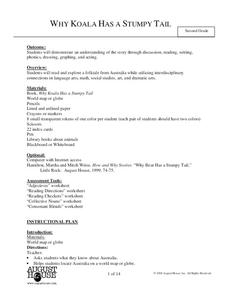
Why Koala Has a Stumpy Tail
Second graders explore Australian folktales. In this folktales lesson, 2nd graders gain knowledge about Australia and it's animals by reading books and discussion. Students find the adjectives in the book and write what they describe....
Curated OER
How Trees Contribute to the Water Cycle
In this water cycle instructional activity, 3rd graders conduct an experiment where they observe and calculate how water transpires in different types of trees. Students engage in a class discussion and use Venn Diagrams to compare...
Curated OER
Math and Literature
Students listen to the reading of "The Button Box" and use buttons provided to tell a story about a chosen button, compare their own buttons to those in the reading. They estimate how many buttons are in a bag and sort buttons based on...
Virginia Department of Education
Properties of Quadrilaterals
What type of quadrilateral is that? Discover the difference between the types of quadrilaterals. Small groups investigate types of quadrilaterals using geometry software to find their properties. To keep track of the different...
Curated OER
Troublesome Towers
Learners observe solids and identify parts that make up the surface area. In this geometry instructional activity, students calculate the surface are of solids and cones. They find polygons and solids in the real world.
Curated OER
"YIKES! Your Body Up Close" by Mike Janulewicz
Students use a Venn Diagram to analyze data from their class.
Curated OER
It's Your Choice
Students compare data and determine the appropriate way to organize the data. They use physical graphs, pictographs, and symbolic graphs to display their data. In addition, they complete a Venn diagram.
Curated OER
The Many Faces of Coins
Students examine and discuss the designs on the circulating coins produced by the United States Mint. They read about the woman and child featured on the Golden Dollar. They compare and contrast coins using a Venn Diagram.
Curated OER
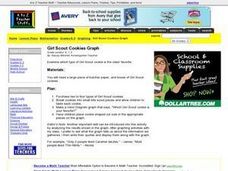
Girl Scout Cookies Graph
Students graph which girl scout cookies they like the best. They create a Venn Diagram about which one is their favorite. They place cookie shaped cutouts on the correct spot on the graph.
Growing Minds
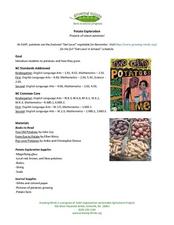
Potato Exploration: Projects All About Potatoes!
How many potatoes tall are you? Unearth this rich resource! A reading of John Coy’s Two Old Potatoes begins a cross-curricular exploration of potatoes. Class members read, write, weigh, measure, and experiment with potatoes. Additional...
Curated OER
Model and Solve Algebraic Equations
Examine multiple ways to solve algebraic equations. Pupils will generate a problem solving strategy that addresses the prompt given by the teacher. They will then share their problem solving strategy with the class. Graphic organizers,...
Curated OER
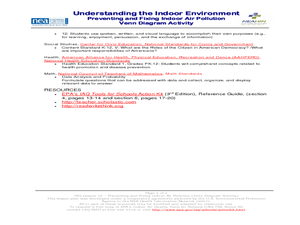
Understanding the Indoor Environment:Preventing and Fixing Indoor Air Pollution
Learners explore air pollution. In this environmental studies lesson, students work with a partner to create a Venn diagram comparing and contrasting possible solutions to prevalent indoor air pollution problems. Learners...
Curated OER
Gila Monsters Meet You at the Airport
Second graders listen to "Gila Monsters Meet You At the Airport" and complete venn diagrams of geographical areas.
Curated OER
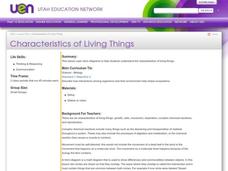
Characteristics of Living Things
Students examine the characteristics of living things. They list the differences between living and non-living things, explore areas around the school, and create a Venn diagram for items found in the school areas.
Curated OER
Frog and Toad
Second graders learn vocabulary and use of words, set, attribute Venn diagram. They learn to describe attributes.
Curated OER
Let's Learn About Jobs
Pupils evaluate the jobs that their parents do. In this literature-based social studies lesson, the teacher introduces the concept of work both at home and on the job and leads the children in the creation of a Venn diagram to aid in...
Curated OER
Soils
Students apply knowledge of soil, environmental impacts, economics, multiple human demands, and use given data for a proposed scenario in making land use decisions. They debate land use issues and/or scenarios and discuss a case study.
Curated OER
Cloudy with a Chance of Meatballs
Young scholars explore the 5 themes of geography. In this cross curriculum literacy and geography lesson, students listen to Cloudy with a Chance of Meatballs by Judi Barrett, and make a list of the needs of the people in Chewandswallow....
Curated OER
French Fry Run
Student explore estimation and measurement. In this measurement lesson, 2nd graders measure french fries, graph their data, and determine the size of french fries that is the best value. Students practice how to add prices and calculate ...
Curated OER
Calendar Communication
Young scholars identify days, dates, and month on a calendar. In this calendar lesson, students use a blank calendar page and fill in the days of the month. Young scholars recall what they learned on specific days and record that...
Curated OER
M & M Counting Chart
Students create an individual M&M's graph based on the number of each color of candy pieces in their handful of candy. They graph the favorite color of the whole class while practicing counting and color identification.
Curated OER
Mathematics Within: Bar And Pie Graphs
Students compare and contrast the use of bar and pie graphs with the same data. They create a data set by surveying all students in the class using sticky notes to make a table on the board. Then, each student creates a bar and pie graph...
Curated OER
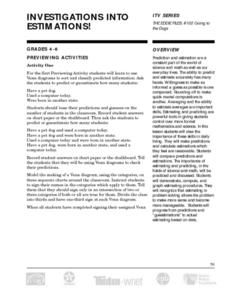
Investigations into Estimations
Students gain the powerful tools of estimation, prediction, and averaging and discover the importance these tools have in daily living.

