Curated OER
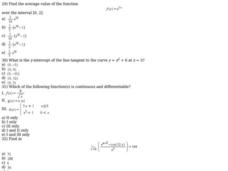
Converging Series
In this functions instructional activity, students calculate the average value, continuity, and the radius of convergence. There are 17 multiple choice questions.
Curated OER
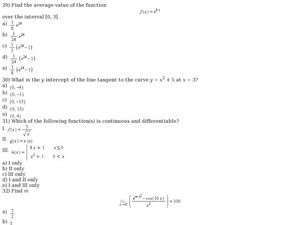
Average Value of a Function
For this calculus worksheet, 12th graders calculate the line tangent to a curve and find the average value of a function. There are 12 questions.
Pennsylvania Department of Education
Introducing the Coordinate Plane
Fifth graders practice using estimation. In this estimation instructional activity, 5th graders add, subtract, multiple, and divide using whole numbers, fractions, and decimals. Students decide upon instances when estimation is more...
Curated OER
Comparison of Images Formed by Plane, Cylindrical, and Spherical Mirrors
Learners observe how reflections differ in various types of mirrors. For this reflection lesson, students use cylindrical mirrors, plane mirrors, and concave mirrors to observe how each reflects the student's face.
Curated OER
Vectors
Young scholars differentiate distance and displacement. In this physics lesson, students use formulas to calculate for displacement. They draw vectors using the grid.
Curated OER
Unit Circle Triangle
Learners find the different ratios of a right triangle. In this geometry lesson, students apply the concept of the Pythagorean theorem as they identify the different angles and parts of a Unit Circle. They find the ratios of sine,...
Curated OER
Charting Attendance Rate of Busch Gardens
Sixth graders, in groups, are given different parts of the whole project. They use information from Busch Gardens to explore line graphs, averages, and other math vocabulary.
Curated OER
Comparison of Images Formed by Plane, Cylindrical (concave side), and Spherical (concave side) Mirrors
Students study mirrors and see how images can be reversed. In this reflection lesson students demonstrate that all mirrors reverse images and that the apparent right to left reversal in a plane mirror is a result of that reversal.
Curated OER
Surface Meteorological Observation System (SMOS)
Learners monitor local surface weather conditions for at least 30 days. They interpret the data by graphing it and detemining percentages.
Curated OER
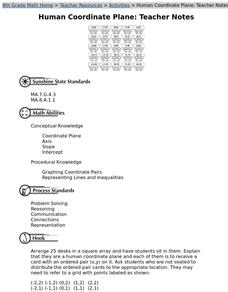
Human Coordinate Plane
Eighth graders form a human coordinate grid to develop knowledge of the placement and meaning of coordinates on a grid. They experience the placements of the x and y coordinates in an ordered pair.
Curated OER
Bungee M&M's
Eighth graders experiment with M&M's and a cup attached to a spring to to simulate a bungee jump. They graph the results of the experiment and make predictions for continuing the experiment. They determine the "line of best fit."
Curated OER
Graph It
First graders collect classroom data (such as mode of transportation used to get to school) and prepare a pictograph to interpret the information.
Curated OER
"Graph It"
Students work in teams to conduct short surveys of their classmates. They show their results using at least two different types of graphs.
Students separate into teams and are asked that each team to choose something that they are...
Curated OER
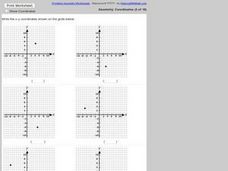
Identifying Points in the Coordinate Plane
For this ordered pairs worksheet, students identify 6 ordered pairs given a coordinate plane. Students list the ordered pair given the graph.
Curated OER
Plotting Points
In this middle school mathematics/Algebra I worksheet, students plot points on a coordinate plane. The one page worksheet contains six problems. Answers are not provided.
Curated OER
Graphing
Seventh graders identify the different graphs used in science. For this graphing lesson, 7th graders analyze the three kinds of graphs. They construct a graph that best describes a given data.
Curated OER
Displaying The Data
Learners engage in a research project to find information about one's personal family heritage. They collect information by conducting family interviews. Students use the data to create a graph, map, and timeline. Then learners take part...


