CK-12 Foundation
Linear and Non-Linear Function Distinction: Domain and Range of a Function
Functions are special types of relations, but what makes them so special? Pupils use an interactive to slide a vertical line across six different graphs. Ten challenge questions then assess understanding of functions.
Curated OER
Interpreting Graphs
Students investigate graphs. In this graphing lesson plan, students create a graph regarding the population of California. Students extrapolate answers concerning the data set.
Curated OER
Grasping Graphs
For this grasping graphs worksheet, students solve and complete 3 different types of problems. First, they graph the data described and select the appropriate graph type. Then, students identify the independent and dependent variable. In...
Willow Tree
Slope
Investigate the different types of slope using graphs and ordered pairs. Scholars use the slope formula to determine the slope of a line between two points. Includes examples with a slope of zero and with no slope. The instructional...
West Contra Costa Unified School District
Graphing Family of Functions
Functions have families, too. Learners first graph the parent functions for linear, quadratic, and cubic functions, and then use vertical translations to graph families of functions.
Mt. San Antonio Collage
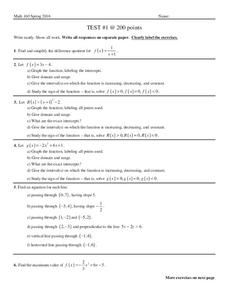
Test 1: Graphing Functions
Graph the night away with all the different types of functions provided in the worksheet. Linear, quadratic, and rational all ask for graphs, domain and range and other key factors about the functions.
Education Development Center
Points, Slopes, and Lines
Before graphing and finding distances, learners investigate the coordinate plane and look at patterns related to plotted points. Points are plotted and the goal is to look at the horizontal and vertical distances between coordinates and...
Curated OER
Animal Brains
Do big bodies make big brains? Let your learners decide whether there is an association between body weight and brain weight by putting the data from different animals into a scatterplot. They can remove any outliers and then make a line...
CK-12 Foundation
Existence: One-to-One Functions and Inverses
One-to-one means the answer is simple, right? Given four graphs, pupils use a vertical line to test each graph to find out if they are one-to-one. By using the resource, learners realize that not all one-to-one relations are functions....
CK-12 Foundation
Inverse Functions: Definition of Inverse Functions
Is the inverse of a function also a function? Pupils manipulate the graph of a function to view its inverse to answer this question. Using a horizontal and vertical line, class members determine whether the initial function is...
Curated OER
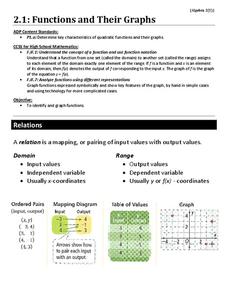
Functions and Their Graphs
Use a worksheet to go over the basic concepts of relations and functions. Included are clear definitions and examples of relations, domain and range, and functions and the vertical line test. However, the problems are pretty basic. A...
Curated OER
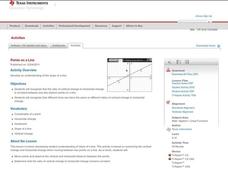
Points on a Line
How do you find slope? You use points on a line of course. slope. Teach your class how to calculate and differentiate between horizontal and vertical lines. They are sure to be pros at graphing lines on a coordinate plane by the end of...
Alabama Learning Exchange
Building Functions: Inverse Functions from Tables and Graphs
Is the inverse a function? Scholars learn how to examine a function to answer this question. Using an online interactive, they examine the properties of inverse functions to compare to the original function.
Curated OER
Walking the Plank
This is a cool math activity. Kids collect and interpret data based on a physical act. A board is balanced between a scale and a step, learners record a peer's weight as it decreases while s/he walks further away from the scale. They...
Curated OER
Understanding Latitude and Longitude
Teaching learners about latitude and longitude can get a little complicated. Present the concept by first representing it as a graph. Just like finding a location on a graph using the x and y-axis, learners will be able to locate items...
Curated OER
Equations of Horizontal and Vertical Lines
Students are given graphs of lines and asked to write an equation. In this algebra lesson, students are asked to write the equations for horizontal and vertical lines. They write equations for line crossing and going through coordinate...
Curated OER
Human Population Growth
In this human population growth worksheet, students create a graph of human population growth and predict future growth using the data given in a chart. Students identify factors that affect population growth.
Curated OER
Comparing Data on Graph A and Graph B
Second graders gather and graph data. In this graphing lesson, 2nd graders collect data and graph this information using tally charts, bar graphs, pictographs, or tables. They make predictions about the outcomes.
Curated OER
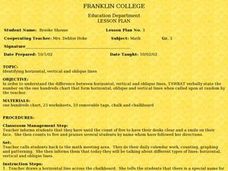
Identifying Horizontal, Vertical and Oblique Lines
Third graders watch the teacher draw a horizontal line across the board. They listen to the definition of horizontal and has a student demonstrate putting their body in a horizontal position. This is repeated with a vertical line. The...
Curated OER
Line & Scatter (What Would You Use: Part 2)
High schoolers discuss line graphs and scatter plots and the best situations in which to use them. Using the graphs, they determine the type of correlation between variables on a scatterplot. They create a scatterplot and line graph...
Curated OER
Graphing Using Cookies
Pupils differentiate between bar graphs, line graphs, pictographs and bar graphs. After participating in a hands-on cookie activity, students label and draw their own graphs.
Curated OER
Data Analysis 2
In this data analysis worksheet, students read and interpret given line graphs. They determine the range and average. This one-page worksheet contains five problems.
Curated OER
Systems of Linear Inequalities
Graphing systems of linear inequalities is the focus of this worksheet. Problems range from checking solutions of inequalities, graphing systems of two inequalities, and graphing systems of three inequalities. Graphing horizontal lines,...
Flipped Math
Reflections
Take some time to reflect on graphing. Learners count a point's distance from the line of reflection to create reflections of geometric figures. Given the rules for four basic lines of reflections, pupils determine the points to create...


