Other
Interactive Data Structure Visualizations: Binary Tree Traversals
A great visualization / animation tool that illustrates the different traversal algorithms used with binary trees.
Brown University
Brown University Library Center: Perry Visits Japan: A Visual History
Showcases a beautiful Japanese scroll that depicts Commodore Matthew Perry's landing in Japan in 1854 and a set of lithographs by Willam Heine that illustrate Perry's expedition. These visual images accompanied by student essays are...
Curated OER
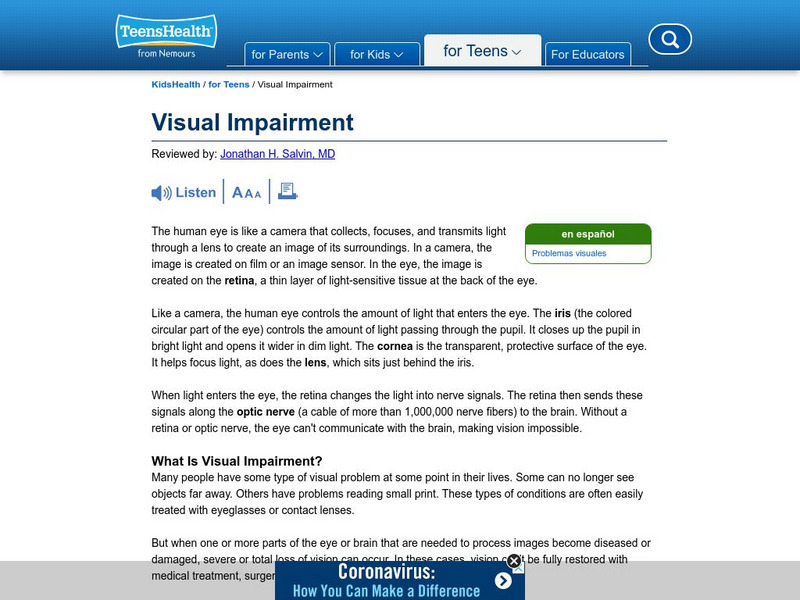
Kids Health: Visual Impairment Facts
Written by an ophthalmologist, this site provides detailed information on the definition and causes of visual impairments, also including information on diagnosis. Be sure to click on tabs down the right side of the article for...
Lumen Learning
Lumen: Boundless Communications: Effective Visual Delivery
This lesson focuses on effective visual delivery including appropriate dress and open posture, eye contact and facial expressions, body movements and gestures, and effective visual aids.
Exploratorium
Exploratorium: Science Snacks: Vocal Visualizer
Create a vocalizer device out of PVC piping and, with the help of a laser pointer, use it to project a visualization of the sound vibrations you make with it.
Terres en Vues (Land InSights)
Land in Sights: Visual Arts: Raphael Benedict
Examine work by visual artist Raphael Benedict, who was the Merite Press-Papier 2002 award winner and learn how he has won the trust of his people.
University Corporation for Atmospheric Research
Ucar: Visualizing Weather and Climate
With visualizations, we can see the entire planet from all angles at once. We can see the invisible - such as water vapor in the atmosphere and the way air flows around the world.
TeachEngineering
Teach Engineering: Tears in Rain
The goal of this activity is for students to develop visual literacy. They learn how images are manipulated for a powerful effect and how a photograph can make the invisible (pollutants that form acid rain) visible (through the damage...
Merriam-Webster
Merriam Webster: Visual Dictionary Online
Picture dictionary with 6,000 pictures that illustrate American English words organized around different themes, such as astronomy, clothing, transporation, and sports. With access to a vocabulary-esque game of the week. [Has wraparound...
University of Regina (Canada)
University of Regina: Math Central: m.c.escher: Mathematics and Visual Arts
This cross-curricular middle school unit integrates mathematics and visual art. Through the study of the M.C. Escher?s work, students explore tiling from both a mathematical and artistic point of view. Points for discussion and...
University of Virginia Library
Prism: "Learning to Chunk" Visualization
[Free Registration/Login Required] See the results of how users have highlighted Roald Dahl's "Learning to Chunk." Details that show characterization are blue while details that appeal to visualization or the senses are red and questions...
Science Buddies
Science Buddies: An Experiment in Visual Perception
Graphical methods of data presentation are a key feature of scientific communication. This project will get you thinking about how to find the best way to communicate scientific information.
Yad Vashem, The World Holocaust Remembrance Center
Yad Vashem: Jews and Sport Before the Holocaust: A Visual Retrospective
This exhibition tells the stories of Jewish athletes and the sports they took part in all over Europe prior to the Holocaust, of which many did not survive.
Edutopia
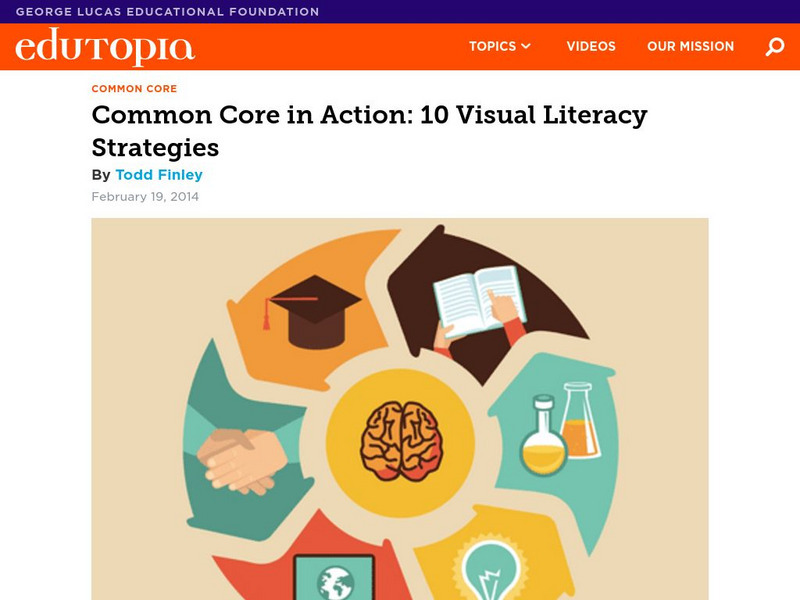
Edutopia: Common Core in Action: 10 Visual Literacy Strategies
Explicitly teach a collection of competencies that will help students think through, think about, and think with pictures.
Terres en Vues (Land InSights)
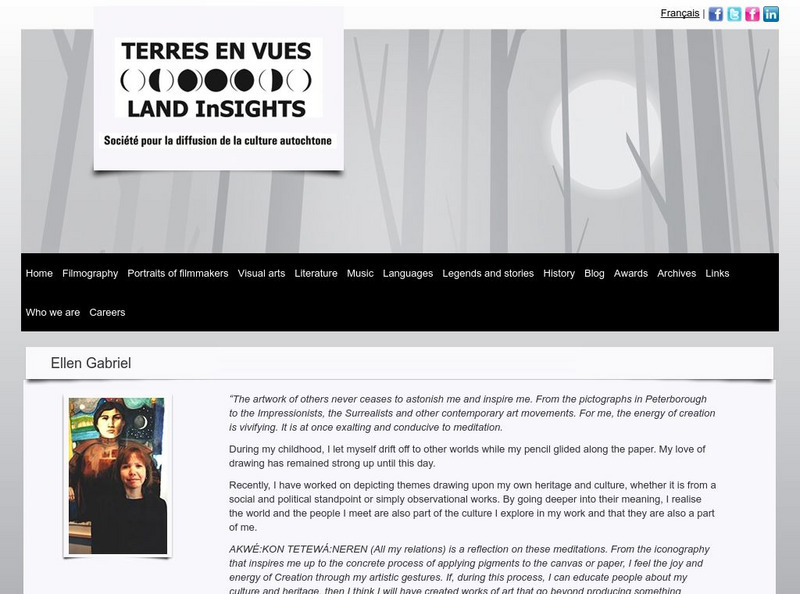
Land in Sights: Visual Arts: Ellen Gabriel
View Ellen Gabriel's depiction of the Oka crisis by examining several examples of her work.
Other
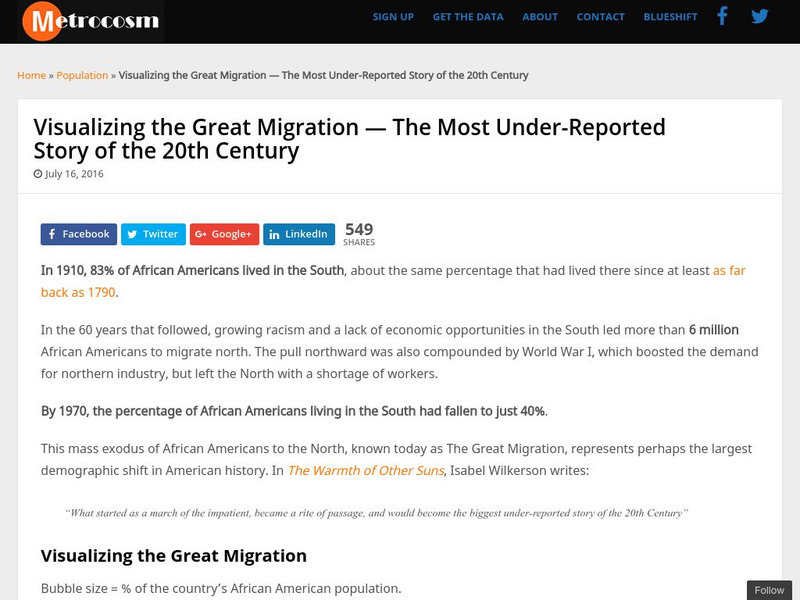
Metrocosm: Visualizing the Great Migration
The Great Migration had a profound impact on many aspects of American life. Watch this map to see how the growth of African Americans living in the north grew from 1910-1970. Read the reasons for the migration and the challenges they...
Alabama Learning Exchange
Alex: Using Digital Notebook to Visualize Thematic Links
Learners will work in groups of two or three to produce two pages of a digital scrapbook covering a thematic element from Macbeth. The pages will then be assembled into a visual review of the play's themes and character motivations...
Intel Corporation
Intel Engage: Visual Ranking Tool
This thinking tool allows teachers to structure activities for student learning that involve making decisions, defending choices and comparing data. Project ideas and lessons are included. Free registration is required for use of the...
Davidson College
Davidson College: Visualization of Atomic Orbitals: S Orbitals
Discusses the geometry of the s orbitals and presents exercises for exploring their shape and orientations. Requires Java.
Online Writing Lab at Purdue University
Purdue University Owl: Visual Rhetoric: Using Fonts With Purpose
The first of four pages discussing appropriate font choices and the effect font choice can have on the meaning and feeling attached to a work.
Science Buddies
Science Buddies: Proect Ideas: Investigating Inattentional Blindness
The goal of this human behavior science fair project is to investigate inattentional blindness and visual perception and see what percentage of a test population notices an unexplained object in a video. The Science Buddies project ideas...
Science Buddies
Science Buddies: The Brains Behind 'Where's Waldo?'
What makes you notice someone in a crowd? Why do some things stand out, while others melt into the background? In this experiment you can investigate the psychology of how things get noticed, by studying how our brains perform a visual...
Mathematics Archives
Math Archives: Visual Calculus: Rational Functions
An explanation of what comprises the domain of a rational function. The information is brief, but formulas and examples are given along with additional links.
University of Virginia Library
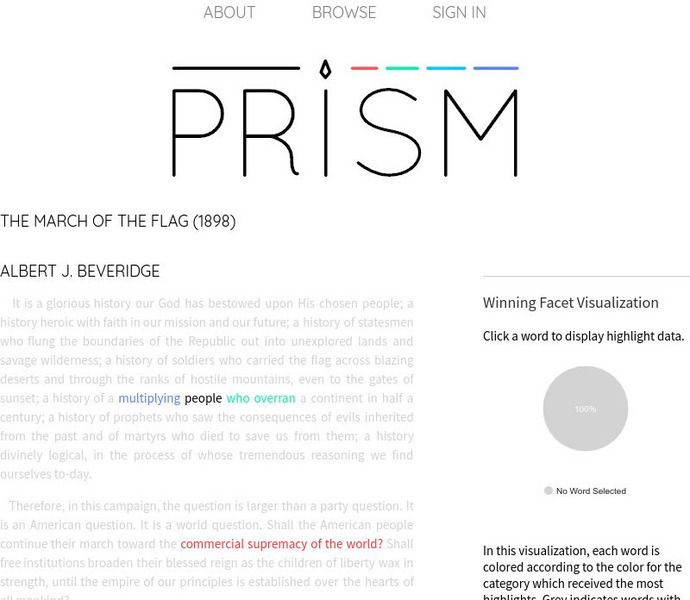
Prism: "The March of the Flag" Visualization
[Free Registration/Login Required] See the results of how users have highlighted Albert J. Beveridge's "The March of the Flag (1898)." Text highlighted in blue shows benevolence while red shows economic interest in red, and...
Other popular searches
- Visual Arts
- Visually Impaired
- Visual Art Self Portrait
- Visual Art Lesson Plans
- Teacher Resources Visual Art
- Visual Art Lessons
- Visual and Performing Arts
- Visual Art Lessons Symmetry
- Visual Discrimination
- Visual=art
- Visual Art Tessellations
- Visually Impaired Blind


