National Geographic
National Geographic: Visualizing Watershed Health
Using data visualizations that show dissolved oxygen levels, students analyze the health of the Chesapeake Bay watershed. They will also learn about dead zones, which are aquatic areas where there is insufficient oxygen to support life....
PBS
Pbs Learning Media: Visualizing Topography
Explore the topography of a hill, a valley, and a cliff in this interactive activity featuring visualizations of three-dimensional topography in two dimensions. Adapted from Stephen Reynolds' "Visualizing Topography."
Vision Learning
Visionlearning: Data: Using Graphs and Visual Data in Science
An explanation of how data can be turned into visual forms which can help people comprehend information easier than observing numbers.
Wisc-Online
Wisc Online: Avoiding Design Mistakes When Creating Visuals
Using visuals in a speech can enhance the speech and captivate the audience, only if used effectively. Review design errors and learn how to avoid them when choosing visuals for your speech. SL.11-12.5 Audio Visuals
TED Talks
Ted: Ted Ed: Making a Ted Ed Lesson: Visualizing Complex Ideas
How can animation convey complex, intangible concepts? A visual metaphor, or an idea represented through imagery, can take an idea as massive as Big Data and tie it to the familiar depiction of a growing tree. TED-Ed animators explain...
TED Talks
Ted: Ted Ed: A Cinematic Journey Through Visual Effects
It's been 110 years since Georges Melies sent a spaceship slamming into the eye of the man on the moon. So how far have visual effects come since then? Working closely with the Academy of Motion Picture Arts and Sciences, Don Levy takes...
Terres en Vues (Land InSights)
Land in Sights: Visual Arts: Ashukan
View examples of Ashukan, which is songs, visual arts and traditional crafts representing contemporary First Nations, by Jean-Pierre Fontaine and Isabelle Courtois.
Utah Education Network
Uen: Picture This: Visualization
Students will practice the reading comprehension skill of visualizing. Teachers will model the skill with All the Places to Love by Patricia MacLachlan. Then students will listen to Robert Service's poem "The Shooting of Dan McGrew" and...
NASA
Nasa Visualization Studio: Earth Science Week 2015: Visualizing Earth Systems
NASA provides a gallery of Earth science visualizations. The gallery was created for Earth Science Week in 2015. It includes a guide for teachers, and blogs from various NASA visualizers, scientists and science educators.
Illustrative Mathematics
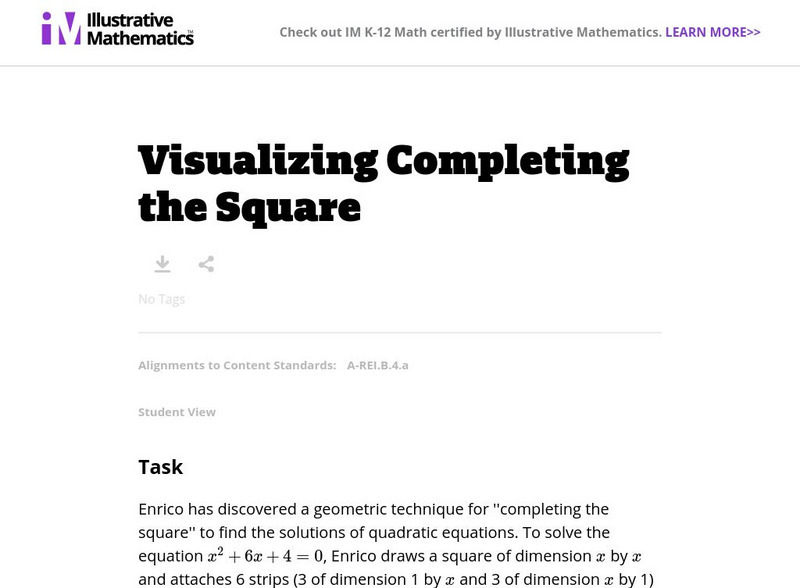
Illustrative Mathematics: A rei.b.4.a: Visualizing Completion of the Square
The purpose of this visualization task is to help provide geometric intuition for the algebraic process called ''completing the square.'' Aligns with HSA-REI.B.4.a.
National Humanities Center
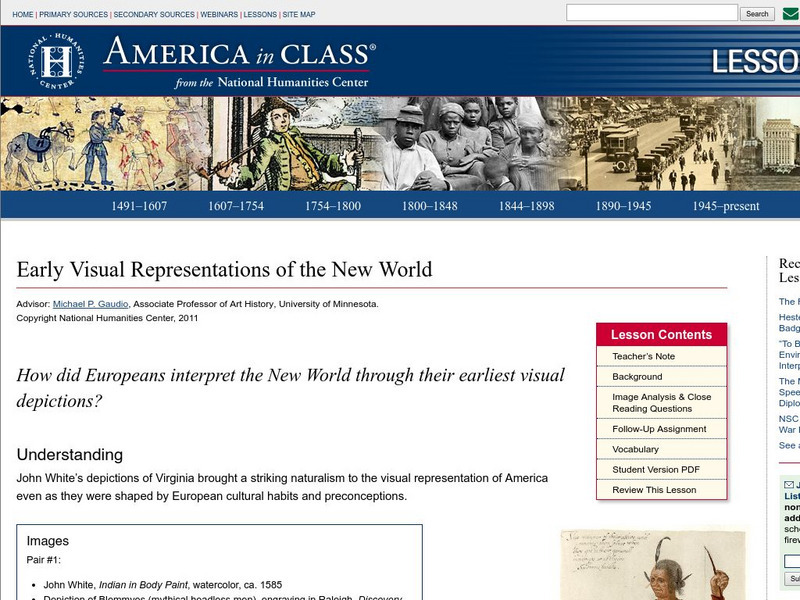
National Humanities Center: America in Class: Early Visual Representations of the New World
A lesson that examines how Native Americans were portrayed by artists in the sixteenth century, whose aim was to convey their appearance to a European audience, and thereby encourage investment in future New World explorations. By...
Better Lesson
Better Lesson: Visual Representations in Informational Text
Students will look at examples of illustrations and diagrams in informational texts and discuss how each one helps enhance the text. Students gain the knowledge that sometimes a picture is worth a thousand words because a complex idea...
Smithsonian Institution
Smithsonian Learning Lab: Portraits: Written and Visual
A wonderful resource on the lives and work of American authors, Louisa May Alcott and Samuel Clemens. You will get a unique look at them through the study of their portrait and their writing. Includes two great lesson plans.
York University
York University: African Canadian Online: Visual Art
Here you will find samples of artists' works along with biographies. Note that copying of any images from this site is strictly prohibited without written permission from the artist.
South Carolina Educational Television
Etv: Visual and Performing Arts: Drawing, Painting and Illustrating
Artopia is an excellent art resource for students. They are able to examine important works of art, learn about styles, principles, and processes of the various art forms used in painting, drawing, and illustration, and view videos of...
NASA
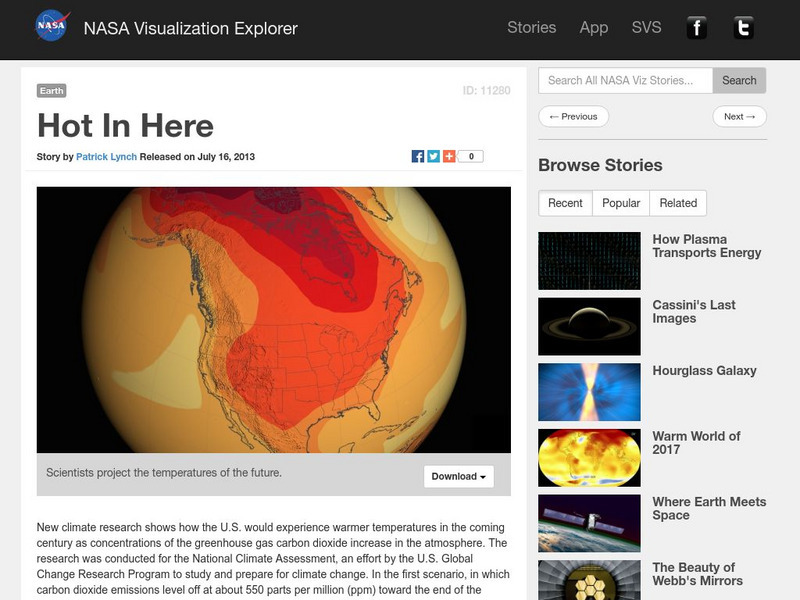
Nasa Visualization Explorer: Hot in Here
This interactive resource from NASA shares scientific projections about temperatures of the future.
Davidson College
Davidson College: Visualization of Atomic Orbitals: Hybrid Orbitals
Explains the creation of hybrid orbitals and presents their electron density plots and energy diagrams. Requires Java.
Other
Sarah Sanderson Science: Visual Summaries
This strategy asks students to draw the main ideas in a text.
Better Lesson
Better Lesson: Compound Events Visual Displays of Sample Spaces
Seventh graders will be able to represent the sample space of compound events, and calculate the probability of events using their sample space.
Terres en Vues (Land InSights)
Land in Sights: Visual Arts: Sylvain Rivard
View works by Sylvain Rivard and learn how his background and linguistic skills make him an invaluable resource within the First Nations culture.
Terres en Vues (Land InSights)
Land in Sights: Visual Arts: Jacques Newashish
View works by Jacques Newashish, painter and printmaker and learn what influences his work.
Cornell Lab of Ornithology
Habitat Network: Wildlife Habitat Category in the Groups Data Visualization
Habitat Network has combined all the vegetatively-complex habitat polygons into categories here.
Virtual Salt
Visual Salt: Elements of the Gothic Novel
This site gives a listing and description of the typical elements usually found in gothic novels. It also provides a list of example vocabulary typically found in gothic novels.
Other
Metrocosm: Visualizing the Flow of Asylum Seekers
Watch this dynamic map to understand the flow of asylum seekers to industrialized countries. Click the interactive map to see statistics for specific countries. Data used to construct these maps from the UN Refugee Agency 2013-2016.
Other popular searches
- Visual Arts
- Visually Impaired
- Visual Art Self Portrait
- Visual Art Lesson Plans
- Teacher Resources Visual Art
- Visual Art Lessons
- Visual and Performing Arts
- Visual Art Lessons Symmetry
- Visual Discrimination
- Visual=art
- Visual Art Tessellations
- Visually Impaired Blind


