Vision Learning
Visionlearning: Data: Using Graphs and Visual Data in Science
An explanation of how data can be turned into visual forms which can help people comprehend information easier than observing numbers.
Wisc-Online
Wisc Online: Avoiding Design Mistakes When Creating Visuals
Using visuals in a speech can enhance the speech and captivate the audience, only if used effectively. Review design errors and learn how to avoid them when choosing visuals for your speech. SL.11-12.5 Audio Visuals
TED Talks
Ted: Ted Ed: Making a Ted Ed Lesson: Visualizing Complex Ideas
How can animation convey complex, intangible concepts? A visual metaphor, or an idea represented through imagery, can take an idea as massive as Big Data and tie it to the familiar depiction of a growing tree. TED-Ed animators explain...
TED Talks
Ted: Ted Ed: A Cinematic Journey Through Visual Effects
It's been 110 years since Georges Melies sent a spaceship slamming into the eye of the man on the moon. So how far have visual effects come since then? Working closely with the Academy of Motion Picture Arts and Sciences, Don Levy takes...
Other
Plu: Designing and Delivering Multimedia Presentations: Why Use Visuals?
The advantages to incorporating visuals into a multimedia presentation are explained. SL.9-10.5 Audio Visuals. CCSS.ELA-Literacy.CCRA.SL.5, SL.11-12.5 Audio Visuals
NASA
Nasa Visualization Studio: Earth Science Week 2015: Visualizing Earth Systems
NASA provides a gallery of Earth science visualizations. The gallery was created for Earth Science Week in 2015. It includes a guide for teachers, and blogs from various NASA visualizers, scientists and science educators.
Illustrative Mathematics
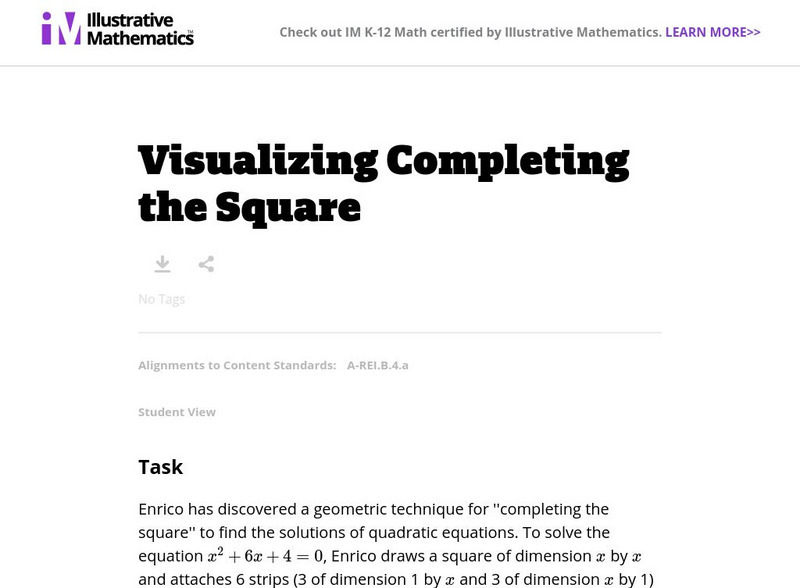
Illustrative Mathematics: A rei.b.4.a: Visualizing Completion of the Square
The purpose of this visualization task is to help provide geometric intuition for the algebraic process called ''completing the square.'' Aligns with HSA-REI.B.4.a.
Smithsonian Institution
Smithsonian Learning Lab: Portraits: Written and Visual
A wonderful resource on the lives and work of American authors, Louisa May Alcott and Samuel Clemens. You will get a unique look at them through the study of their portrait and their writing. Includes two great lesson plans.
York University
York University: African Canadian Online: Visual Art
Here you will find samples of artists' works along with biographies. Note that copying of any images from this site is strictly prohibited without written permission from the artist.
Other
Museo Nacional Bellas Artes: Artistas Visuales Chilenos
This site provides biographical information, images of works and literature of over 1000 Chilean artists.
NASA
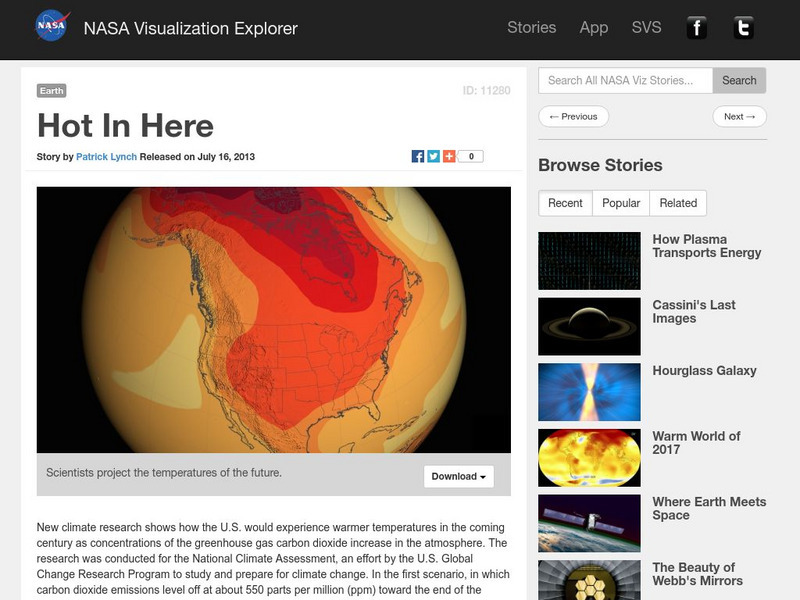
Nasa Visualization Explorer: Hot in Here
This interactive resource from NASA shares scientific projections about temperatures of the future.
Davidson College
Davidson College: Visualization of Atomic Orbitals: Hybrid Orbitals
Explains the creation of hybrid orbitals and presents their electron density plots and energy diagrams. Requires Java.
University of Toronto (Canada)
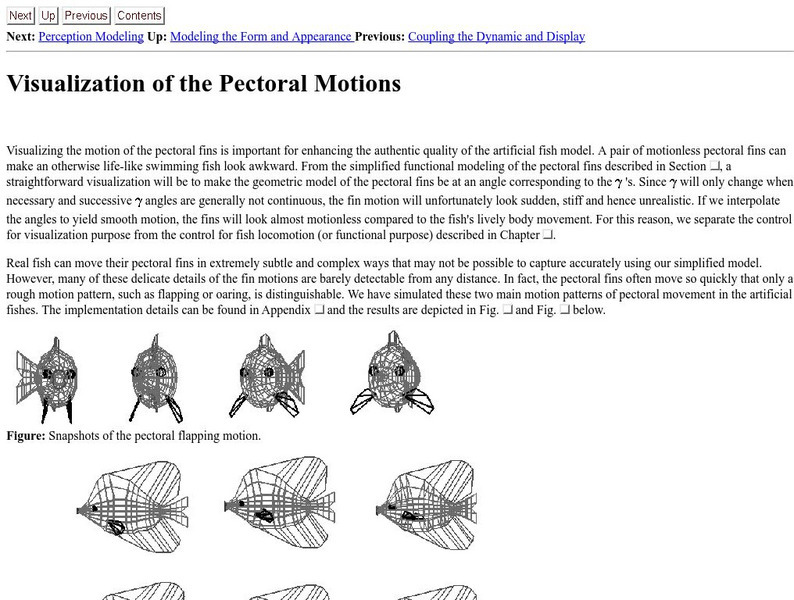
University of Toronto: Visualization of Pectoral Motion
Provides information and illustrations about the role of pectoral motion in fish locomotion.
TED Talks
Ted: Ted Ed: Visualizing the World's Twitter Data
Good morning, Twitter! Millions of tweets are sent everyday, and from these tweets, we can gather a lot of information about people's lives: where they travel, when they wake up, and their opinions on pretty much everything. Jer Thorp...
Other
Metrocosm: Visualizing the Flow of Asylum Seekers
Watch this dynamic map to understand the flow of asylum seekers to industrialized countries. Click the interactive map to see statistics for specific countries. Data used to construct these maps from the UN Refugee Agency 2013-2016.
TED Talks
Ted: Ted Ed: How Optical Illusions Trick Your Brain
Optical illusions are images that seem to trick our minds into seeing something different from what they actually are. But how do they work? This learning module walks us through a few common optical illusions and explains what these...
Brown University
Brown University: Seeing Theory
This resource provides interactive visualizations of probability concepts. Covers basic probability, compound probability, probability distributions, frequentist inference, Bayesian inference, and regression analysis. The authors are...
University of Virginia Library
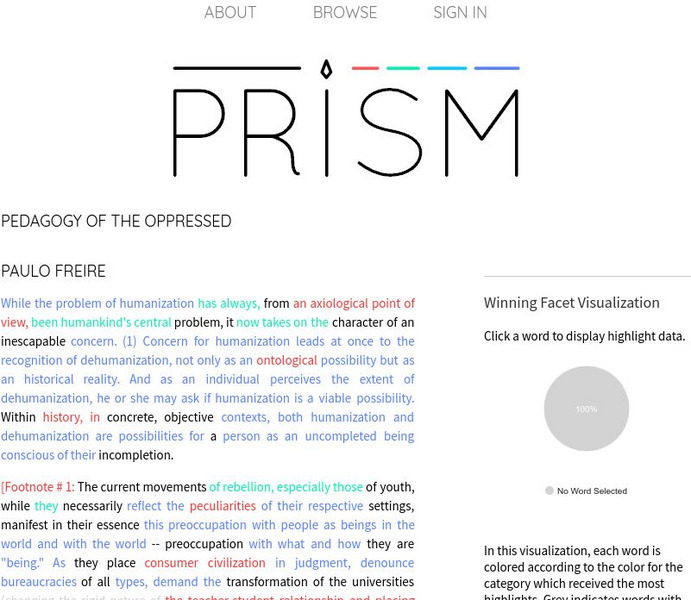
Prism: "Pedagogy of the Oppressed" Visualization
[Free Registration/Login Required] See the results of how users have highlighted Paulo Freire's "Pedagogy of the Oppressed." Text highlighted in blue represents insightful details, red represents things that are difficult to understand,...
University of Virginia Library
Prism: "Influences on Achievement" Visualization
[Free Registration/Login Required] See the results of how users have highlighted Grant Wiggins' blog post "Influences on Achievement." Strategies we currently use are blue while strategies that are easy to begin are red, and the most...
University of Virginia Library
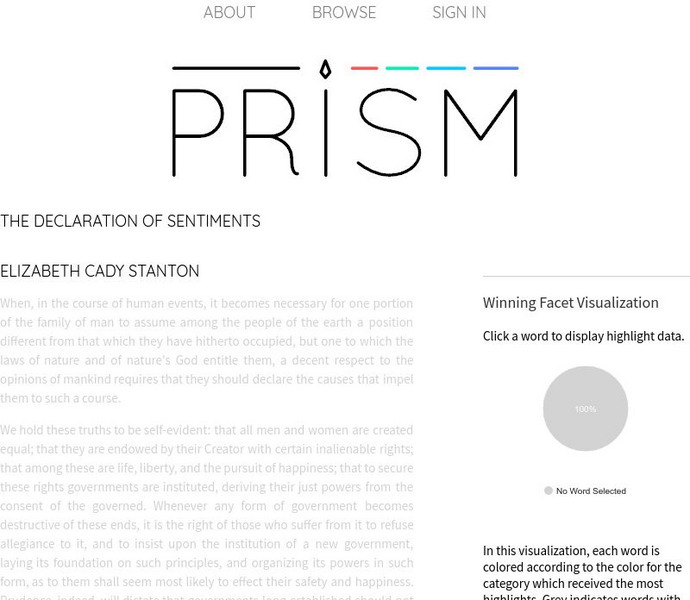
Prism: "The Declaration of Sentiments" Visualization
[Free Registration/Login Required] See the results of how users have highlighted Elizabeth Cady Stanton's "The Declaration of Sentiments." Details that show unjust treatment are blue while details that show feminism are red, and details...
Sophia Learning
Sophia: Choosing Whether to Use Software or Technology to Enhance Ideas
A tutorial explaining how to use technology to create graphics and visuals to enhance documents and presentations. A brief audiovisual presentation identifies types of visuals, and another audiovisual presentation describes how and when...
Lumen Learning
Lumen: Boundless Communications: Using Statistics
This lesson focuses on using statistics in your speeches including understanding statistics, common misunderstandings of statistics, guidelines for helping your audience understand statistics, and using visual tools for incorporating...
Digital History
Digital History: The Artist in American Society
See how the creation of visual art in its many forms developed over the first half of the 19th century. In addition of the painters in the Hudson River School of Art, read about the beautification of natural spaces such as parks, and...
TED Talks
Ted: Ted Ed: A 3 D Atlas of the Universe
Carter Emmart has been coordinating the efforts of scientists, artists, and programmers to build a complete 3D visualization of our known universe. He demos this stunning tour and explains how it's being shared with facilities around the...
Other popular searches
- Visual Arts
- Visually Impaired
- Visual Art Self Portrait
- Visual Art Lesson Plans
- Teacher Resources Visual Art
- Visual Art Lessons
- Visual and Performing Arts
- Visual Art Lessons Symmetry
- Visual Discrimination
- Visual=art
- Visual Art Tessellations
- Visually Impaired Blind


