Common Sense Media
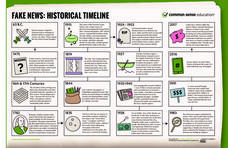
Fake News: Historical Timeline
In 1874, The New York Herald falsely claimed that several animals escaped from the Central Park Zoo, and panic ensued. Using the helpful infographic, pupils discover more instances of fake news throughout history, from as far back as 63...
Common Sense Media
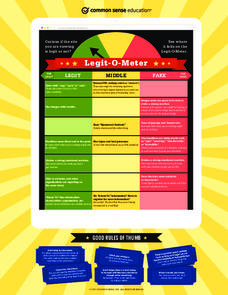
Legit-O-Meter
Pop-ups, banner ads, grammar mistakes ... these are all signs of an untrustworthy website. With the handy Legit-O-Meter poster, scholars can now double-check their sources to ensure accurate, reliable information. The color-coded poster...
Twin Cities Medical Society
Should I Talk to My Kids about Vaping?
Enlist parents and guardians in an anti-vaping campaign with an infographic that offers suggestions for how to talk with their students about e-cigarettes and e-liquids. The visual includes information about the dangers of vaping as well...
Curated OER
Washington, D.C. Map
Here is an outline map of Washington, DC. Some of the points of interest in the city are labeled, as are Maryland, Virginia and Arlington. There are plenty of important monuments and locations not identified, making for a good...
Other
Bucks County Community College: Visual Organizers
This site walks you through the benefits of visual organizers, and focuses on a variety of types: tables, charts, graphs, timelines, flowcharts, diagrams, and webs.
NOAA
Noaa: Ngdc: Images, Visualizing Data
The National Geophysical Data Center has transformed extensive ocean research into colorful video, 3D maps, charts posters and more! This site starts off with a film clip of a dive into the Marianas trench and then lead you to other...
Other
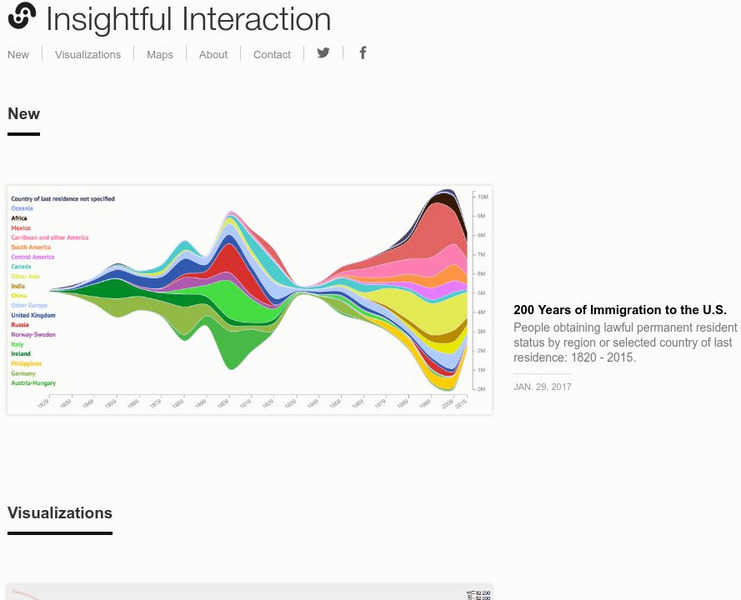
Insightful Interaction: Visualizations
A collection of interactive visualizations that were produced through analysis of economic, political, and market research data. Topics are diverse, e.g., military spending and trade, immigration, consumer spending, crime, unemployment,...
Other
Rothman and Burdumy: Trans Atlantic Slave Trade Visualization
Time-lapsed heatmap visualization of the Trans Atlantic Slave Trade. Data from Transatlantic Slave Trade Database mapped in a three-part depiction of voyages, ship disembarkment location and ship arrival location in the Americas.
Other
Miami Dade College: Vic 1000 Visual Comm Lecture Notes Ch. 14, 17, 18 [Pdf]
These are the lecture notes from a course on visual communication that uses Herbert Zettl's book "Sight Sound Motion." This PowerPoint outline (in PDF format) identifies the key points in chapters 14, 17, and 18. These chapters are about...
Other
Miami Dade College: Vic 1000 Visual Comm Lecture Notes Chapters 4 and 5 [Pdf]
These are the lecture notes from a course on visual communication that uses Herbert Zettl's book "Sight Sound Motion." This PowerPoint outline (in PDF format) identifies the key points in chapters 4 and 5. Chapter 4 looks at the...
Wisc-Online
Wisc Online: Avoiding Design Mistakes When Creating Visuals
Using visuals in a speech can enhance the speech and captivate the audience, only if used effectively. Review design errors and learn how to avoid them when choosing visuals for your speech. SL.11-12.5 Audio Visuals
Sophia Learning
Sophia: Imagining & Visualizing: Tutorial
In this slideshow tutorial, students will review the reading strategies of imagining and visualizing to assist with interpreting stories' characters, events, and settings. Students are given an explanation of the strategies and examples...
Other
Write Design: Graphic Organizers: Visualize
Lists and describes several types of graphic organizers which fall under the "visualize" mold, including sketches, diagrams, and thumbnails.
Other
Hubspot: Data Visualization 101: How to Design Charts and Graphs
Your data is only as good as your ability to understand and communicate it, which is why choosing the right visualization is essential. Learn more in this guide.
Mathematics Archives
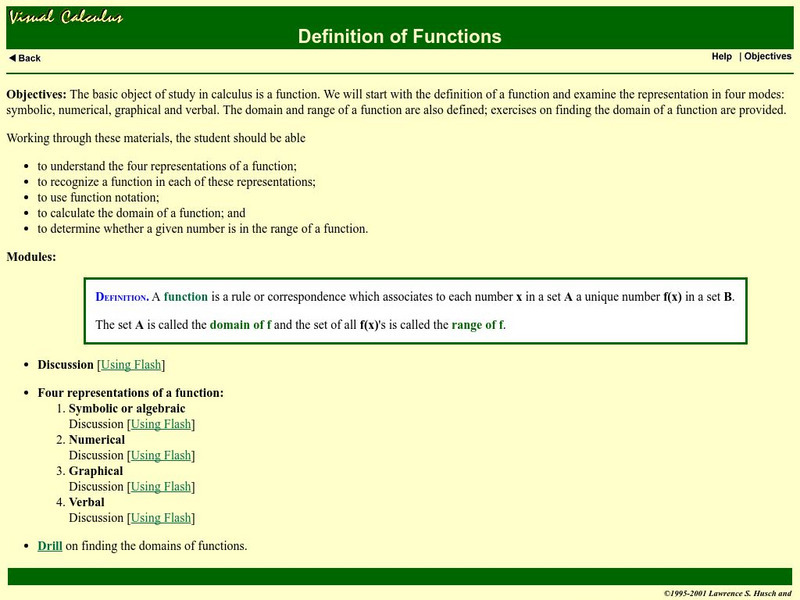
Math Archives: Visual Calculus: Functions
Use this site to find the defintion of a function. The site offers a discussion on the vertical line test, symbolic, numerical and verbal discussions on the definition of a function.
Mathematics Archives
Math Archives: Visual Calculus: Tangent Lines to Polar Graphs
This site give the formula for finding the slope of the tangent line to a polar graph. The page offers step by step explanations and worked examples.
PBS
Pbs: Simon Schama: The Story of the Jews: Explore the Diaspora: Visual Timeline
A timeline beginning in 587 B.C.E. when the Jews are exiled into Babylonia through persecution under the Roman Empire on through the Crusades, World War II up to the construction of the "Separation Wall." This thorough resource follows...
University of Pittsburgh
Digital Research Library: Visuals for Foreign Language Instruction
This site contains hundreds of illustrations that can be used to support instructional tasks such as describing objects and people (i.e., teaching vocabulary) or describing entire events and situations (i.e., teaching grammar).
York University
York University: African Canadian Online: Visual Art
Here you will find samples of artists' works along with biographies. Note that copying of any images from this site is strictly prohibited without written permission from the artist.
Other
Smith College: Vistas: Visual Culture in Spanish America
A collection of photographs, artwork, and architecture of Spanish America from pre-1500 through the 1900s.
Other
The Visual Dictionary: Volume 3: Human Body
Academic resource where students learn about the human body through images that explain objects. Click on an image to get a fully defined, detailed view of a particular body part.
Rice University
Rice University: Cynthia Lanius: Visualizing an Infinite Series
This site explains the infinite series through visualization.
Smithsonian Institution
Smithsonian: Visual Thinking: Curator's Choice
This resource provides several curator-selected sketchbooks, from the Smithsonian's archives, belonging to different American artists working during the period from 1840 to 1970.
Other
Noodle Tools: Visual Literacy Presentation [Pdf]
Learning to "read" the images that surround us is an important 21st century skill. This series of slides, presented in .pdf format, provides lots of examples, exercises and resources.
Other popular searches
- Visual Arts
- Visually Impaired
- Visual Art Self Portrait
- Visual Art Lesson Plans
- Teacher Resources Visual Art
- Visual Art Lessons
- Visual and Performing Arts
- Visual Art Lessons Symmetry
- Visual Discrimination
- Visual=art
- Visual Art Tessellations
- Visually Impaired Blind


![Miami Dade College: Vic 1000 Visual Comm Lecture Notes Ch. 14, 17, 18 [Pdf] PPT Miami Dade College: Vic 1000 Visual Comm Lecture Notes Ch. 14, 17, 18 [Pdf] PPT](https://content.lessonplanet.com/knovation/original/359118-c1bd17cc99d5f06b71c98634a7967136.jpg?1661556435)
![Miami Dade College: Vic 1000 Visual Comm Lecture Notes Chapters 4 and 5 [Pdf] PPT Miami Dade College: Vic 1000 Visual Comm Lecture Notes Chapters 4 and 5 [Pdf] PPT](https://d15y2dacu3jp90.cloudfront.net/images/attachment_defaults/resource/large/FPO-knovation.png)


