Curated OER
Compare Sets of Objects Guided Lesson
Practice math vocabulary terms fewer, more, and data using this visual-object-analysis guide. Learners observe three sets of objects and answer three questions, two of which compare numbers of objects, and the last which...
Curated OER
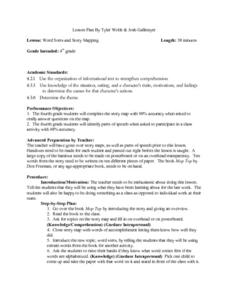
Word Sorts And Story Mapping
Fourth graders engage in a lesson that covers the concept of using a storymap to increase reading comprehension. They possess the prior knowledge of parts of speech from previous lessons. Students fill in the blank storymap while working...
Curated OER
Mapping Deep-Sea Habitat
Students create a two-dimensional topographic map and a 3-D model of landforms. In this creative lesson students create 2 and 3-D objects and learn how to interpret the data from these things.
Curated OER
Graphs Galore
Fourth graders conduct surveys to collect data. They analyze and interpret the data, then determine which type of graph is appropriate for the data. Students use the data to make predictions, discover patterns and draw conclusions...
Curated OER
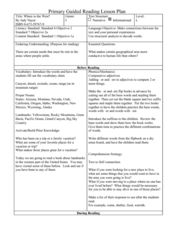
"Where in the West" Guided Reading Lesson
Learners complete a vocabulary chart, review proper/common nouns, discuss and review comparative adjectives and make "self to text" connections before reading. In this language arts lesson, comprehension questions are completed during...
Curated OER
Mystery of the Alaskan Seamounts
High schoolers study seamounts and the processes that form them. In this Gulf of Alaska lesson students interpret data and investigate a hypothesis.
Curated OER
The Crucible
Twelfth graders use an Internet scavenger hunt, vocabulary, sample essay questions, and short answer questions suitable for study and review of the play, The Crucible.
Curated OER
"Texas T"
Students examine how the discovery of oil replaced cotton and changed the Texas economy from agricultural to industrial. They read primary source documents, define key vocabulary terms, and create a bookmark.
Curated OER
Move To a Healthier Aquatic Balance
Fourth graders examine aquatic orgnaisms and how enviromental chages affect them. This factors include: temperature, Ph, oxygen, nutrients, and pollutants. They also explore habitat quality (erosion). Students compile data and create...
Curated OER
Variables and Patterns: Determining an appropriate scale while graphing
Sixth graders determine appropriate scales when graphing data. For this graphing lesson, 6th graders use an the applet "Graph It" to determine what is an appropriate scale for their data.
Curated OER
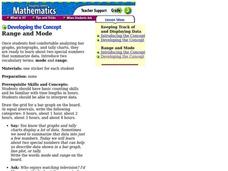
Range and Mode
Fifth graders interpret data. In this mode and range lesson, 5th graders define mode and range and practice finding them given a set of data.
Curated OER
Reading and Writing Program Using Core Knowledge Literature
Students improve their reading and writing skills using Step Up to Writing and Six Traits of Writing techniques. Students complete a Robinson Crusoe vocabulary crossword, a Treasure Island character analysis web, reading comprehension...
Curated OER
What Are The Chances
Students calculate the probability of an event occurring. In this probability lesson, students differentiate between independent, dependent or compound events. They find the range of the data.
Curated OER
INTRODUCTION TO THE PERIODIC TABLE
Students identify the scientist who first wrote the Periodic Table, identify the scientist who amended the Table, state (or write) specific data relating to the history of the Periodic Table, identify at least five elements, and two...
Curated OER
Complete Metamorphosis
Students use a map and colored pins to plot the migration path of Monarch butterflies. They use data found at the Journey North website. Commas are also used in the activity to show how they are put in a series of words using butterfly...
Curated OER
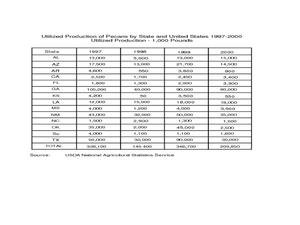
Pecan Power
Students study the origins of pecans and complete a bar graph from the data they have discovered. For this pecan lesson plan, students draw pecans, discuss a pecan time line, and draw a bar graph comparing Arizona pecans to other...
Curated OER
Proportions in Stories
Students solve problems dealing with ratios and proportions. In this algebra instructional activity, students rewrite word problems using equations and symbols. They correctly convert between percents and decimals.
Curated OER
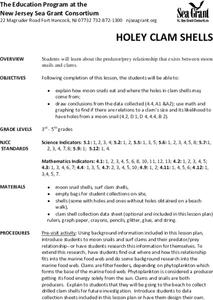
Holey Clamshells
Pupils analyze data to make hypotheses and conclusions regarding the predator/prey relationship between moon snail and surf clams.
Curated OER
Graphing Changes in Weather
Students graph current temperature and weather conditions for three days. In this weather lesson plan, students go to the Weather Channel's website and look up weather for their zip code then graph the conditions and record the...
Curated OER
The Greenhouse Effect
Seventh graders investigate the temperature change in open and closed containers. In this earth science lesson, 7th graders relate this lab activity to greenhouse effect. They create a line graph from data collected in the experiment.
Curated OER
The Tell - Tale Heart
Students read The Tell Tale Heart and practice critical analysis while reflecting on its underlying meanings. In this reading lesson, students make predictions, monitor their own comprehension and adjust their reading accordingly....
Curated OER
Frog and Toad
Second graders learn vocabulary and use of words, set, attribute Venn diagram. They learn to describe attributes.
Curated OER
Introduction to Polynomials
Students analyze the graphs of polynomial functions, examine vocabulary associated with polynomials, and determine the maximum number of real roots possible for a polynomial
Curated OER
CLEAN AIR ACT (1990)
Young scholars investigate the effects of acid rain by conducting an experiment with bean sprouts and graph the results. In this Environmental Policy lesson, students visit a museum to identify examples of foreign and domestic policy on...

