Other
Bright Hub: Technology Used to Collect Weather Data
Technology used to collect weather data employs a number of devices such as satellites and weather balloons to perform a very important function to our daily living; forecasting the weather.
CK-12 Foundation
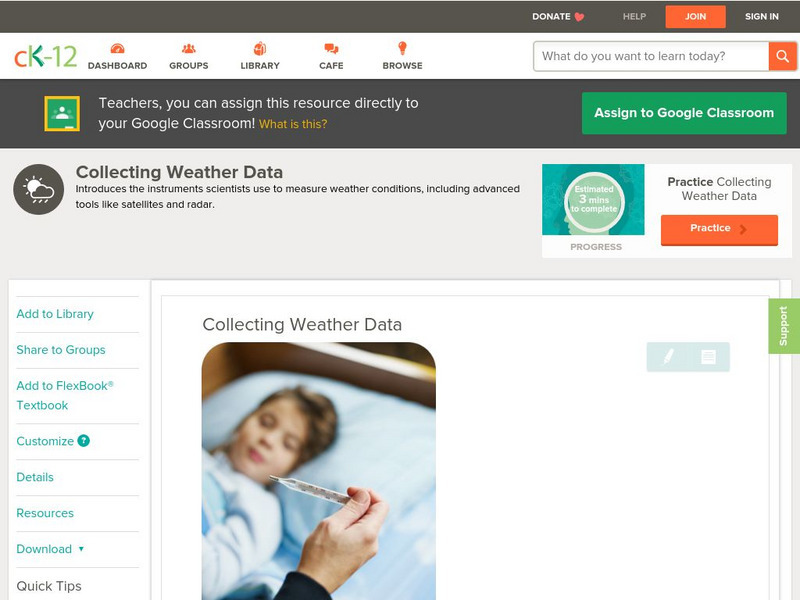
Ck 12: Earth Science: Collecting Weather Data
[Free Registration/Login may be required to access all resource tools.] Describes the various instruments that scientists use to collect weather data.
CK-12 Foundation
Ck 12: Earth Science: Collecting Weather Data
[Free Registration/Login may be required to access all resource tools.] Describes the various instruments that scientists use to collect weather data.
Texas Education Agency
Texas Gateway: Scientific Investigation and Reasoning Data Organization
Using interactive exercises, students will review how to construct tables and graphs in order to organize data.
Scholastic
Scholastic: Gather Data: Experiment With Weather
Simple guidelines for building several weather-related tools: anemometer, wind vane, barometer, rain gauge, snow gauge, and thermometer. After building your tools, follow experiment steps and record your findings on the Scholastic...
Center for Innovation in Engineering and Science Education, Stevens Institute of Technology
Ciese Real Time Data Projects: The Stowaway Adventure
Through this series of Internet-based learning experiences and activities, students will use real-time data to track a real ship at sea and monitor weather conditions. Includes a teacher's guide with problem-solving lesson plans...
PBS
Pbs Learning Media: Daily and Seasonal Weather: Interactive Lesson
Students investigate the relationship between daily weather and seasonal weather. Students will read about how weather data is collected, then interpret examples of weekly and monthly weather data to find seasonal patterns. Visual...
Texas Instruments
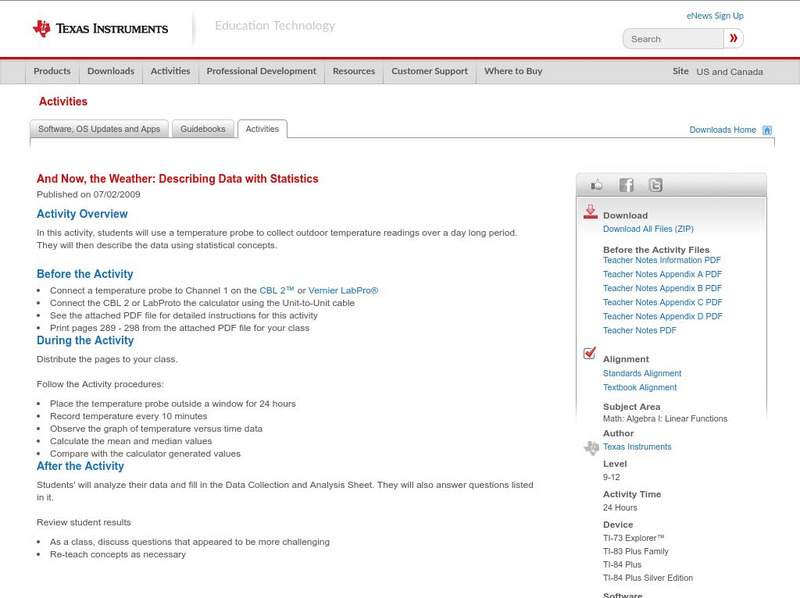
Texas Instruments: And Now, the Weather: Describing Data With Statistics
In this activity, students can use a temperature probe to collect outdoor temperature readings over a day long period. They will then describe the data Using statistical concepts.
NOAA
Noaa: Weather and Atmosphere
The collections in this thematic area provide educational resources that introduce concepts of weather and atmosphere. It provides activities and data for exploring weather and atmospheric sciences, and link to emerging research on these...
University Corporation for Atmospheric Research
Ucar: Project Sky Math
Teachers will be interested to explore the SkyMath module, and the 16 classroom activities at this site. In this program, students will collect and record real-time weather data to analyze. Data analysis, graphing, number relationship,...
University Corporation for Atmospheric Research
Ucar: Differences Between Climate and Weather
In this activity, students collect weather data over several days or weeks, graph temperature data, and compare the temperature data collected with averaged climate data where they live.
Other
Classzone: Weather Forecasters Use Advanced Technologies [Pdf]
An excerpt from an earth science textbook. The chapter shown here covers concepts about how weather data is collected, displayed and how meteorologists forecast fronts and storms.
Center for Innovation in Engineering and Science Education, Stevens Institute of Technology
Ciese: Collaborative Projects
Using a variety of science topics, these projects link your class with classes around the world in data collection and analysis. There are projects recommended for all grade levels. Begin dates and end dates are listed to help in...
Science Education Resource Center at Carleton College
Serc: Danger in the Air
In this learning module, students are involved in an observational study of air pollutants in the atmosphere. The students collect and examine air quality and weather data, looking for correlations between weather and air quality.
Better Lesson
Better Lesson: Graphing January's Weather
First graders graph the weather in Vermont for the month of January.
Texas Instruments
Texas Instruments: Sunrise, Sunset: Weather Match
Students determine the relationship between temperature and light intensity. They use a Temperature Sensor and a Light Intensity Sensor to collect temperature and light intensity data for a period of 24 hours. They understand the effect...
The Franklin Institute
Franklin Institute Online: Make Your Own Rain Gauge
Make a simple rain gauge to measure the precipitation.
Science Education Resource Center at Carleton College
Serc: Do You Really Want to Visit the Arctic?
This jigsaw activity is designed for students to become familiar with several datasets of Arctic weather data, collected in Eureka on Ellesmere Island. Students join a role-playing activity to read and interpret graphs while considering...
NOAA
Noaa: Cpc: Weekly Enso Update
Weekly updates on data collected and analyzed by the Climate Prediction Center. Includes sea surface temperature, subsurface tropical Pacific analyses and much more. Extensive site: check it out!
Texas Instruments
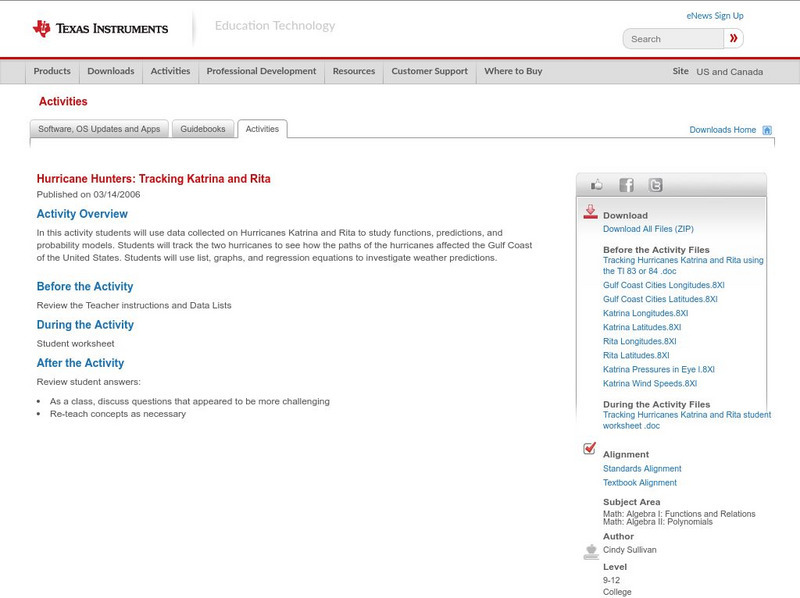
Texas Instruments: Hurricane Hunters: Tracking Katrina and Rita
In this activity students can use data collected on Hurricanes Katrina and Rita to study functions, predictions, and probability models. Students will track the two hurricanes to see how the paths of the hurricanes affected the Gulf...
Science Education Resource Center at Carleton College
Serc: The Nature of the Land Around Us
An inquiry investigation which allows students to drive their learning by creating questions about the land around them. They collect varied data to analyze the nature of the land, and as a result, investigate erosion and weathering in...
Science Education Resource Center at Carleton College
Serc: Measuring and Comparing Temperatures
Using thermometers, students will compare differences in the temperature of various materials and locations. They will record and chart the data that was collected and present the graphs to their classmates.
Microsoft
Microsoft Education Lesson Plan: Making Money From Lemons
Simulation where learners apply mathematics and economics concepts in the lemonade business. Learners set up a virtual lemonade stand and must determine production costs, product variables, and profits. Students record data collected on...


