Science Education Resource Center at Carleton College
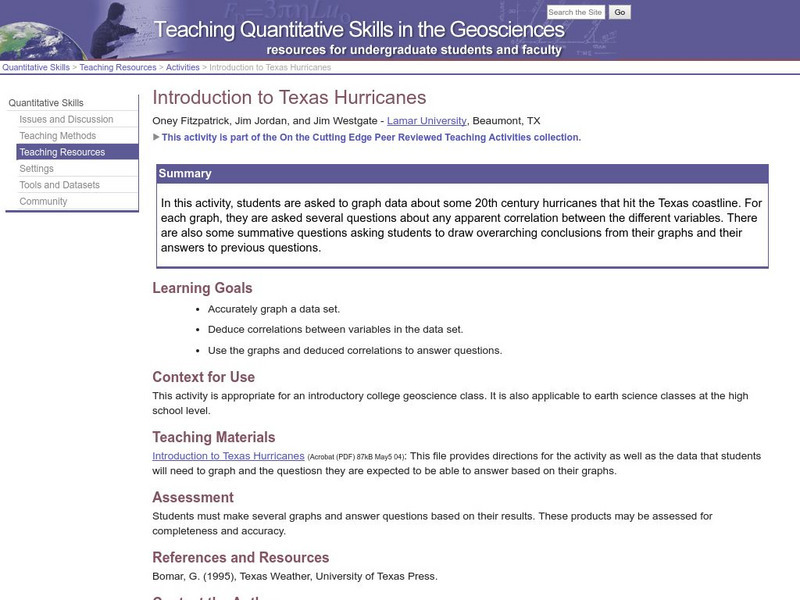
Serc: Introduction to Texas Hurricanes
In this activity, students are asked to graph data about some 20th century hurricanes that hit the Texas coastline. For each graph, they are asked several questions about any apparent correlation between the different variables. Students...
Khan Academy
Khan Academy: Sensors
Part of the Internet of Things, types of sensors are examined including acoustic, visual, weather, GPS, and others.
University Corporation for Atmospheric Research
Ucar: Project Sky Math
Teachers will be interested to explore the SkyMath module, and the 16 classroom activities at this site. In this program, students will collect and record real-time weather data to analyze. Data analysis, graphing, number relationship,...
Science Education Resource Center at Carleton College
Serc: Measuring and Comparing Temperatures
Using thermometers, students will compare differences in the temperature of various materials and locations. They will record and chart the data that was collected and present the graphs to their classmates.
Other
Geoscience Research Institute: The Little Ice Age
This very detailed article examines the long-term climate changes throughout the world. Discusses agriculture and provides graphs and illustrations. Includes lots of scientific discussion.
The Environmental Literacy Council
Environmental Literacy Council: Temperature
The difference between heat and temperature is explained, followed by a discussion of temperature and its relation to global climate change. Gallileo Galilee, Daniel Gabriel Fahrenheit, Anders Celsius, and Carl Linnaeus are mentioned in...
Other
The Learning Partnership: Journey to El Yunque
In this set of learning modules, students examine the impact of hurricane weather on the El Yunque rainforest in Puerto Rico. They learn about hurricanes, producers, consumers, and the food chain, and how disruptions in organisms'...
Texas Instruments
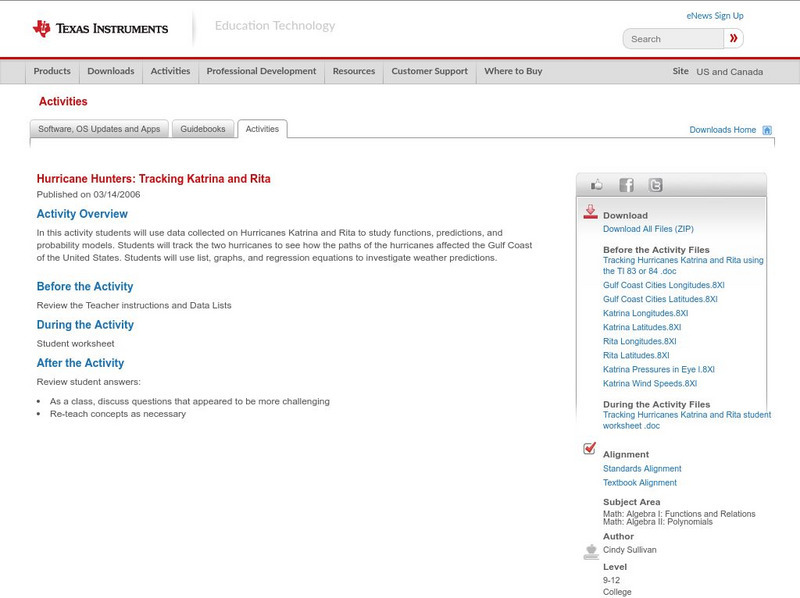
Texas Instruments: Hurricane Hunters: Tracking Katrina and Rita
In this activity students can use data collected on Hurricanes Katrina and Rita to study functions, predictions, and probability models. Students will track the two hurricanes to see how the paths of the hurricanes affected the Gulf...
Science Education Resource Center at Carleton College
Serc: Do You Really Want to Visit the Arctic?
This jigsaw activity is designed for students to become familiar with several datasets of Arctic weather data, collected in Eureka on Ellesmere Island. Students join a role-playing activity to read and interpret graphs while considering...
Other popular searches
- Kindergarten Weather Graph
- Fall Weather Graph
- Daily Weather Graph
- Culture Weather Graph
- Graph Weather Chart
- Graphing Weather
- Graph Weather
- Graphing Weather Data
- Graphing Weather Activity
- Graphing the Weather
- Weather Graphs and Charts
- Weather Graph Template


