Curated OER
The Sky and the Dichotomous Key
Pupils use a dichotomous key to distinguish between different types of clouds
Curated OER
Around the World
Students explore ways people from around the world are like them. They discuss how geography affects the way people live and work and how culture affects a person's day to day life. Students give a presentation over a chosen country to...
Curated OER
Family Letter and Algebra
In this algebra worksheet, students receive a parent informational letter. The letter discusses what will be covered in algebra that school year and has an ordering integers activity.
Curated OER
Reasons for the Seasons
Students discover how the Earth's axis of rotation affects the angle of sunlight and the length of day. They take a survey and give the survey out to family members and friends. They tally their findings and then determine the correct...
Curated OER
Reasons for the Seasons
Sixth graders conduct and analyze a survey that explores public perceptions about the reasons for seasonal change. They measure the changing length of days, observe shadows and discuss how the Earth's axis of rotation affects the seasons.
Curated OER
Using Patterns
In this math instructional activity, 6th graders use the time at home in order to work on the skill of recording data in the form of daily activities and statistics.
Curated OER
Estimating Altitude of Water Cloud Base
Students conduct an experiment to determine dew point and use a formula to detemine altitude. They construct a chart and predict what altitude clouds would form, given the dew point on the ground.
Curated OER
Planet Research
Pupils recognize that the other eight known planets, which revolve around the Sun, have characteristics and surface conditions that are different from Earth; and identify examples of those differences.
University Corporation for Atmospheric Research
Ucar: Weather and Climate Data Exploration
Students explore the relationship between weather and climate by graphing weather temperature data and comparing with climate averages.
Other
Honolulu Hi 5: Cool Maps With Awesome Weather Data Across 1,219 Us Cities
Explore the weather in states and cities across the United States. Two maps with accompanying graphs are provided. The first indicates the number of comfortably warm summer days a place has and the second shows the temperature and how...
TeachEngineering
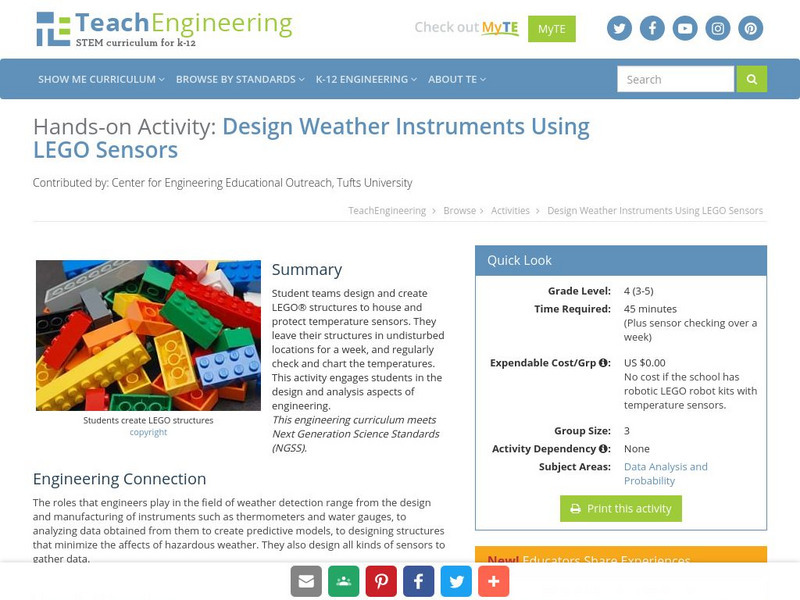
Teach Engineering: Design Weather Instruments Using Lego Sensors
Students will design and create a LEGO structure that will house and protect a temperature sensor. They will leave the structure in a safe spot and check the temperature regularly and chart it.
Better Lesson
Better Lesson: Comparing the Weather
In order to meet Common Core standards, 2nd graders need to be able to interpret data to solve problems. This lesson provides practice in this area. Included in this lesson are a printable temperature chart and a video of second graders...
The Environmental Literacy Council
Environmental Literacy Council: Temperature
The difference between heat and temperature is explained, followed by a discussion of temperature and its relation to global climate change. Gallileo Galilee, Daniel Gabriel Fahrenheit, Anders Celsius, and Carl Linnaeus are mentioned in...
University Corporation for Atmospheric Research
Ucar: Differences Between Climate and Weather
In this activity, students collect weather data over several days or weeks, graph temperature data, and compare the temperature data collected with averaged climate data where they live.
Science Education Resource Center at Carleton College
Serc: Measuring and Comparing Temperatures
Using thermometers, students will compare differences in the temperature of various materials and locations. They will record and chart the data that was collected and present the graphs to their classmates.
Science and Mathematics Initiative for Learning Enhancement (SMILE)
Smile: Aspects of Weather
A detailed weather lesson plan written for the primary, intermediate, and junior high level. Topics covered are weather symbols, thermometer, graphing temperature results, clouds, moisture and air pressure.
Illustrative Mathematics
Illustrative Mathematics: F if Telling a Story With Graphs
For this task, students are presented with three weather-related graphs - on temperature, solar radiation, and precipitation. They are asked to describe the function represented in each graph and tell a more detailed story using...


