Polar Trec
Global Snow Cover Changes
Snow is actually translucent, reflecting light off its surface which creates its white appearance. Pairs or individuals access the given website and answer questions about snow cover. They analyze graphs and charts, examine data, and...
Curated OER
Social Studies - Guessing Game
Focus on a particular geographic location with this resource. Learners use their social studies textbook to look up information about a specific place. They write down a list of facts and read them to the class. Classmates guess which...
Curated OER
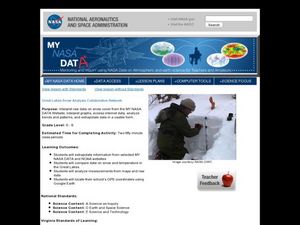
Great Lakes Snow Analysis Collaborative Network
Students interpret data on snow cover and analyze trend patterns. In this snow lesson students compare data and locate their school's GPS coordinates.
Curated OER
Measuring Precipitation
A little engineering design is mixed into this lesson on precipitation measurement. Groups plan and construct a rain gauge, and use it to collect precipitation. As part of the PowerPoint presentation, learners view a satellite map of...
Astronomical Society of the Pacific
Getting Ready for the All American Eclipse!
Give your pupils a front row seat at the biggest light show in the sky this year! In addition to admiring the total solar eclipse, young astronomers can explain the phenomenon with a little help from an inquiry-based instructional...
Curated OER
Cloudy With a Chance of Meatballs
Third graders discuss the weather and how it changes during the different seasons. They listen to a read aloud of Judy Barrett's, Cloudy With a Chance of Meatballs. They write and illustrate a news article about the weather that is found...
Curated OER
Clouds
Students read the "Cloud Book" by Tomie de Paola and create a map of clouds identifying atmospheric conditions, color and type, and what type of weather each cloud indicates. Emphasis is placed on the use of Kidspiration.
Curated OER
Analyzing Meteorological Data From Mars
Students compare real-time Earth and Mars measurements for temperature, wind speed, humidity and atmospheric pressure by accessing Internet-data resources from NASA. They access real-time weather data and maps for their school location.
Curated OER
El Nino
Students explain what El Nino is, where it is located and how it is created. They describe the weather changes caused by El Nino. They draw the patterns of El Nino on a world map. They predict economic effects El Nino has on the areas it...
Curated OER
Our community and New York City
Fourth graders research websites to gather information about New York City and the Ridgewood community. In this New York City and Community lesson, 4th graders make a semantic map. Students write short postcards to send to students...
Curated OER
Clouds
Students observe and record different types of clouds. They use a cloud chart to discuss the three cloud types to see if students can identify the clouds they drew.
Curated OER
Geography Lesson 1
Middle schoolers examine relationship between population centers and sports teams, explore influence of weather on attendance, and research influence of geography, traffic flow and disposable income on site selection for sports stadiums.
Curated OER
Climographs
Learners identify trends and characteristics of climate zones and specific places within. Then, they graph annual climate trends (primarily Temperature and Precipitation) and create, interpret and extrapolate information based on...
Curated OER
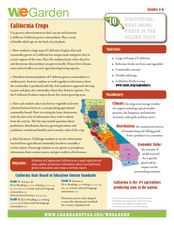
California Crops
Students explore agriculture by researching the native food crops of California. Students define a list of agriculture vocabulary terms and analyze maps of California which explain which foods come from which area. Students write a...
Curated OER
Landforms: Geomorphology of Arkansas
Second graders create large, salt dough maps of Arkansas and the natural regions in the state created by geographical and morphological features.
Alabama Learning Exchange
The Sun and the Earth
Third graders study and diagram the positions of the Earth and sun during the four seasons. They predict weather for cities in the northern and southern hemispheres.
Curated OER
The Path of the Black Death
Students are able to show on a map how the Black Death moved through Europe. They summarize the direct effects of the Black Death in Europe. Students cite evidence from firsthand accounts in developing an argument that connections can,...
Curated OER
River to the Sea
Students investigate the function of wathersheds and weather while they follow Lewis and Clark on their jouney west. They also create a map using acurate measurements and build a model watershed.
Curated OER
Oklahoma Grown: Discovering Oklahoma's Agriculture
Fourth graders investigate where Oklahoma's variety of crops are harvested, and grown their own plants. A printable map and crop information guide are provided.
Curated OER
Estuary and Watershed
Young scholars investigate the San Francisco Bay Estuarine Research Reserve and watershed. In this estuary and watershed lesson plan, students complete 4 activities to better understand estuarine systems. They include studying the San...
Curated OER
Kalahari Explorations
Students explore world geography by completing graphic organizers and researching the Internet. In this Kalahari desert instructional activity, students identify the geographic location, weather and creation of the Kalahari desert....
Curated OER
To Fish or Not to Fish?
Young scholars demonstrate the decision-making process for marine reserves designations. For this role-playing lesson students analyze maps and data relating to a proposed reserve. They formulate the best decisions based on overall issues.
Curated OER
Hurricanes Are They Coming to Your Neighborhood?
Students study weather systems, hurricanes and tropical storms. They predict landfall of hurricanes and tropical storms.
Curated OER
1492: Using Data to Explain a Journey
Students examine how Christopher Columbus made his way across the Atlantic. In this data lesson students use an Internet program to navigate like Columbus.
Other popular searches
- Reading Weather Maps
- Interpreting Weather Maps
- Interpret Weather Maps
- Surface Weather Maps
- Creating Weather Maps
- Weather Maps With Fronts
- Pressure and Weather Maps
- Analyzing Weather Maps
- Construct Weather Maps
- Winds and Weather Maps
- Interactive Weather Maps
- Just Interpret Weather Maps


