Curated OER
Whale Watcher Game Lesson
Students participate in an online whale watching game. They identify the reasons for migration and describe the route. They make predictions on what would happen if the ways did not migrate.
Curated OER
Fluke: Whale Watching Activity
Sixth graders observe and record data about humpback whales in Hawaii. In this humpback whale watching lesson, 6th graders watch the activity of whales from a Hawaiian beach. They record data about their behavior and complete a research...
Curated OER
Location on a Grid
This grid features 15 animals, and scholars use a coordinate system to describe the location of each. The x-axis is labelled with letters and the y-axis with numbers, and they list the coordinate pairs beside the animal names below the...
Sea World
Whales
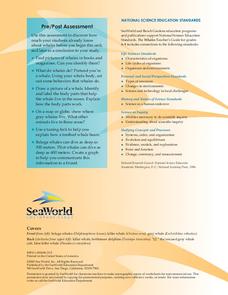
A whale of a lesson is sure to intrigue your elementary oceanographers! Learn about the mammals of the sea with a series of activities about whales, dolphins, and porpoises. Kids complete worksheets about the anatomy of a whale, create a...
Curated OER
How Deep Do They Dive
Students calculate and graph the diving depths of various types of whales. They cut out and glue whale pictures on a worksheet to represent the diving depths for five whales, and discuss how people use graphs to communicate.
Curated OER
Beans and Baleen
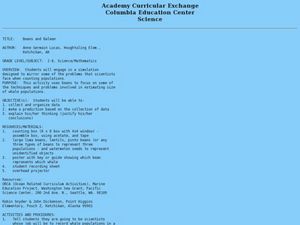
Predict whale populations using different beans as whales! Learners observe different types of beans in a dish knowing that each bean represents a different kind of whale. They then predict how many "whales" there are in a certain area....
Curated OER
Location on a Grid
Make coordinate pairs more engaging by having beginners color-code a grid based on given locations. The grid has numbers along the y-axis and letters along the x-axis, introducing them to the ordering of coordinate pairs with the x-axis...
Curated OER
Histograms: Practice
For this histograms worksheet, students use the bar graph histogram to answer questions 1-4 and the tally chart for question 5. Students finish with two test prep questions.
Curated OER
How big is a whale
Students research the size of whales using print books or the internet. Students do the research in groups. They compare and graph the results.
Curated OER
Communicating Data
In this data instructional activity, students match information with the best type of graph to display it. Students also make a chart and graph to display information in a given paragraph.
Curated OER
Evidence of Evolution by Natural Selection
Walk your junior biologists through the evidence that supports evolution. The fossil record, anatomical record, and molecular record are explained and supported by colorful graphs and pictures. Extensive notes are provided for some of...
Sea World
Splash of Math
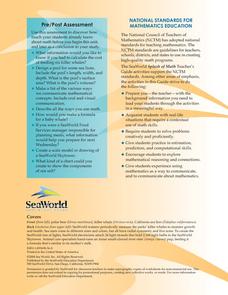
How can kids use math to learn about marine life? Combine math skills with science lessons in a resource featuring activities about life in the sea. Kids graph and calculate data, solve complex word problems, measure geometric shapes,...
Curated OER
Box It Up
Fifth graders make boxes. In this prisms instructional activity, 5th graders read the book Counting on Frank and discuss the different things that the boy measures. Students make boxes of various sizes using graph paper and find their...
Curated OER
A Proportional Fish Story
In this proportions activity, students identify and complete 8 different problems that include using proportions to build scale models of various animals. First, they use the scale to complete the chart and draw lines representing the...
Curated OER
Investigating the Probability
Students investigate probability using coins and dice. They collect data, graph, organize and interpret data. They predict, describe, compare, compute and draw conclusions based on what they observe and record.
Curated OER
Examine Your Attitudes
Students complete a survey about their attitudes toward herps--reptiles and amphibians. They compare their findings, tally them, graph them, and administer the survey to others. Later, they create an education campaign to dispel myths...
Curated OER
Compare Sets of Objects Guided Lesson
Practice math vocabulary terms fewer, more, and data using this visual-object-analysis guide. Learners observe three sets of objects and answer three questions, two of which compare numbers of objects, and the last which asks scholars to...
Curated OER
Snow on Sea Ice
Young scholars examine different samples of ice and predict the amount of snow that has fallen in a given year. Using a calculator, they graph the various thicknesses. They analyze the graphs to determine the relationship between the...
Discovery Education
Sonar & Echolocation
A well-designed, comprehensive, and attractive slide show supports direct instruction on how sonar and echolocation work. Contained within the slides are links to interactive websites and instructions for using apps on a mobile device to...
Curated OER
Miami Metrozoo & Mathematics
Twelfth graders use Algebra and Geometry to solve a real life problem at the Zoo.
Curated OER
Satellite Tracking
Students apply satellite tagging data to investigate questions related to open-ocean animals, their habitats, and their migratory behaviors. They determine how physical or biological factors determine organism behavior using a data...
Curated OER
TE Lesson: Caught in the Net
Learners student the concept of bycatch, the act of unintentionally catching certain living creatures using fishing equipment. They determine the difference between bycatch and target creatures. They discover what species become bycatch...
Curated OER
Sharks
Second graders identify and analyze the many types of sharks that can be found in the Great Barrier Reef in Australia. They also identify what the sharks eat for food, their habitats, and their constuction to the environment and the food...


