Curated OER
Team Apollo
Seventh graders brainstorm about problems with a school track. They research different possibilities for a solution. They test different track materials with erosion, durability, abrasiveness and resiliency. They determine the area,...
Curated OER
Whoa! Slow Down-Some of You!
Students analyze demographic data (growth rate, natural increase, fertility rate, crude birth rates, and crude death rates) and determine which areas of the world contain the fastest and slowest growth rates. They construct population...
Curated OER
Boyle's Law
After viewing this PowerPoint, physical science learners will be able to apply Boyle's law. Background information, reasoning, and data will help in understanding the behavior of gases. There are a few slides that require pupils to...
Illustrative Mathematics
Speed Trap
In which direction is traffic moving faster, north or south? Use box and whisker plots to organize data and interpret the results. Detailed solutions are included. This activity would be good as a warm up or quick assessment at the...
Curated OER
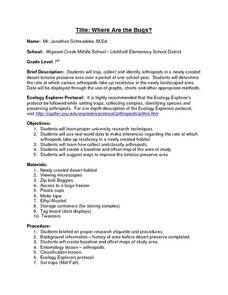
Where Are the Bugs?
Students trap, collect and identify arthropods in a newly created desert tortoise preserve area over a period of one school year. They determine the rate at which various arthropods take up residence in the newly landscaped area. Data is...
Curated OER
Geometry: Parallel and Perpendicular Lines
This basic handout would be good for skills practice or a review of parallel and perpendicular lines. Review the definitions, then practice writing equations of lines that pass through a specific point and are either parallel or...
Curated OER
Human Fingerprints: No Two The Same
Learners will be offered numerous opportunities to further enhance their observational skills as well as the integration of math with their continual exposure to the metric system, measurement, and graphing to represent their data....
Curated OER
Dinosaur Database
Third graders practice using a database to find information related to dinosaurs. Using the data, they make informational cards to use while developing a timeline that shows when dinosaurs roamed the Earth. They answer comprehension...
Curated OER
Stator limbatus Study, Part 1
Second graders experiment identifying beetle emergence and exit holes in seeds, count them, look for beetle eggs with a magnifier and count how many beetle eggs they find. They then graph on a data sheet the findings from their research.
Curated OER
Confidence Intervals: Population Mean; Population standard Deviation Known
In this confidence interval worksheet, students examine a given confidence level and sample data to determine the margin of error, identify a confidence interval, list the mean and give the standard deviation. Students complete seven...
Curated OER
Invasives and Macroinvertebrates
Students view macroinvertebrates, or discuss previous collection activity. They graph data on macroinvertebrates in the Hudson River. Students discuss the relationship between habitat, environmental changes, and invertebrate diversity or...
Curated OER
What Pie?
Students practice making and interpreting pie graphs so they are better able to decide if a pie chart is the appropriate form of display. Students examine included overheads of different pie charts, and directions on how to make pie...
Curated OER
Point Graphs
Students experiment with point graphs. In this math activity, students are divided into groups and perform an experiment to see how high a ball bounces, recording their results on a point graph. Students then answer provided questions.
Curated OER
Shots, Standings, and Shopping
Rates and ratios can easily be applied to real-world situations. Learners explore a series of websites in order to procure comparable data. They define ratios and rates, view videos, and use the internet to explore how ratios and rates...
Curated OER
Creating a Family - Arthropods
Fifth graders make model and write essay of a new family pf arthropods using known data.
Curated OER
Fresh Water and land of Kiribati and Hawaii (Molokai)
Fourth graders examine the islands of Hawaii. Using this information, they organize it and create a map or graph that represents the data. As a class, they discuss how the watersheds on the islands are different and how people react to...
Curated OER
Investigation-How Many Toothpicks?
Seventh graders use toothpicks to investigate a series of designs and identify patterns. Data is organized and analyzed using tables and graphs, and students make generalizations using algebraic expressions.
Curated OER
Word Problem Exchange
Learners discuss elements of word problems: key words, data, computation clues, and unnecessary information and use the four steps of problem solving to find a solution and check for reasonableness.
Curated OER
Fame, Fortune, and Philanthropy
With your middle schoolers, develop concepts such as philanthropy, civic responsibility, community service, and common good. Discuss famous philanthropists and what we can each give of our time, talent and treasure to better our...
Curated OER
Language Learning Course Case Study
English language learners prepare to be a part of the workforce with this resource. Included is a brief survey, the results of that survey, and some intra-office memos. There are several vocabulary terms worth covering like:...
Curated OER
Drug Sales Soar: Bar Graph
In this graphs worksheet, students analyze a bar graph that shows retail prescription drug sales in the U.S. Students complete five problem solving questions about the data on the graph.
Curated OER
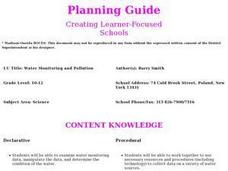
Water Monitoring and Pollution
Students explore the effects of pollution on water supply and how to identify safe drinking water. They test different samples of water over regular intervals and analyze the results to see if they are cyclical or represent a growing...
Curated OER
Scientific Method
In this Scientific Method activity, students demonstrate understanding of the Scientific Method by completing a chart. Students label the important steps taken while using this method in conducting an experiment.
Curated OER
Color Mixing
Students experiment with primary colored water to mix new colors. They record new colors on a simple data sheet and share opinions on their work.


