Curated OER
Let's Get Physical
Explore the benefits of physical activity and how it will affect your students' health. Students track their physical activities for one week and then compare their results. Collaboration with a math teacher woould be useful as it...
Curated OER
Rain Forests: A Disappearing Act?
Students examine and locate rainforests on maps, and research the patterns of their destruction. They develop a bar graph of rainfall and temperature data, write a journal entry, and research the people, animals, and plants/products of...
Curated OER
Proactive police guard outside school
Students conduct research on issues and interests by generating ideas and questions and by posing problems and gather, evaluate and synthesize data from a variety of sources to communicate their discoveries in ways that suit their...
Curated OER
The Bully In The Classroom
Students research bullying as Twemlow defines and reports it. They discuss protection of students from a teacher bully. Students conduct surveys to determine if other students are being bullied by the teacher. Students analyze the data...
Curated OER
Investigation - Looking For Triangles
Seventh graders investigate a series of triangles, looking for patterns and generalizing what they have found. They analyze the pattern data and organize it into a table and graph. Students identify the relationship and discover the rule...
Curated OER
Marine Organisms
Peek into marine life with this mathematics worksheet. A data sheet includes a list of animals and the ocean depth where they can be found. Learners use this information to write the depths as negative integers, order the depths, and...
NorthEast Ohio Geoscience Education Outreach
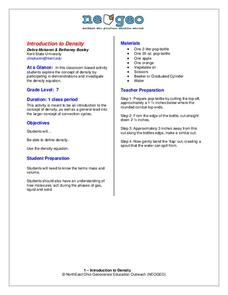
Introduction to Density
Seventh grade scientists weigh in on the concept of density. In a nutshell, they participate in the following activities:
Measurement of the mass and volume of fruit in order to compare densities
Measurement of the mass of oil and water...
Curated OER
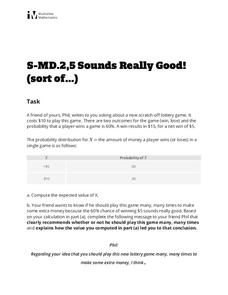
Sounds Really Good! (sort of...)
Your friend Phil wants to know if he should play the lottery. Have your class use the given data to compute the expected value and explain to Phil what he should do and why. This handout is ideal for a quick assessment of skill and...
Curated OER
Soil Porosity, Moisture Content, pH, and Density
This lab activity does not have to be done with AP environmental scientists. It can also be done with middle to high school earth scientists. The procedures aren't complex. Learners determine the density of dry and wet sand in order to...
Curated OER
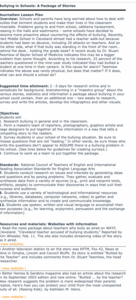
Bullying in Schools: A Package of Stories
Students conduct research on issues and interests by generating ideas and questions and by posing problems and gather, evaluate and synthesize data from a variety of sources to communicate their discoveries in ways that suit their...
Curated OER
Germs Experiment 2
Students express artistic ideas thru art glitter and science. Students experiment with the theory of how germs spread. Students summarize findings in an art format. Students work in groups to analyze data.
Curated OER
Funerals and Burial Rites
Ninth graders research burial practices that originated in West Africa and then migrated to the South Carolina and Ohio. They compare and contrast burial practices in both places. As students collect information and data, they organize...
Curated OER
Becoming A Career Detective (Part 2)
Third graders review and expand their discussion of job training and education resources. They work in small groups to find information about the types of training people need to do specific jobs and use data from interviews carried out...
Virginia Department of Education
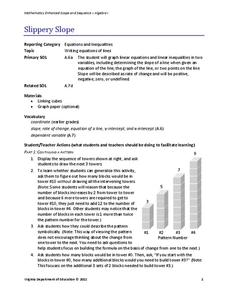
Slippery Slope
Explore slope using geometric patterns. Young mathematicians investigate towers built from cubes to develop a linear pattern. They move the data to a coordinate plane to connect the pattern to slopes.
Virginia Department of Education
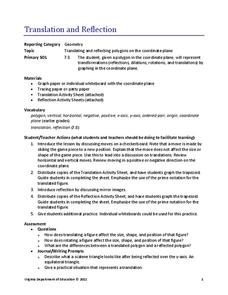
Translation and Reflection
Bring about the change you want to see in the world or at least in your lesson plans. Young mathematicians learn about translation and reflections by applying them to polygons on the coordinate plane. Results provide data to...
Curated OER
Developing the Concept: Rates
Learners discover how to use the knowledge of unit rates to understand equivalent ratios and solve real-world problems. They are given word problems to solve using equivalent ratios. Tables are also covered in this resource.
Curated OER
Nutrition Matters
Investigate nutrition and the food pyramid. Fifth graders will use computer software to write a paragraph about nutrition. They will then diagram the food pyramid and gather and organize a collection of healthy recipes.
Consortium for Ocean Science Exploration and Engagement (COSEE)
Carbon Dioxide & Krill: Impacts
What effects do temperature and carbon dioxide levels have on the zooplankton of Antarctica? This concluding lesson plan in a short unit on climate change and the ocean helps environmental scientists answer these questions. After...
Curated OER
How Much Data is That?
Pupils differentiate between exponential and logarithmic functions. In this algebra lesson, students use logarithmic properties to solve equations. They identify growth and decay of graphs.
Curated OER
Linear Patterns in Data
Eighth graders extend their learning of graphing linear equations and are introduced to connecting patterns in tables and graphs to represent algebraic representations. They then determine patterns and extrapolate information from these...
Curated OER
The football and Braking Distance; Model Data with Quadratic Functions
Students use the quadratic formula to solve application problems. The first problem relates to the path of a football thrown from the top of the bleachers. Students compute the time it will take the football to reach certain heights. In...
Curated OER
How Safe Is Your Backyard?
Seventh graders investigate the safety of soil and water locally and communicate via the Internet with students in different locales sharing information. They research the Internet using its multimedia capabilities and collate the data...
Curated OER
The Stories They Tell -- Conclusions Worksheet
In this cycle of life worksheet, students think about data they collected after a visit to graveyard. Any conclusions they draw from the data are charted on the graphic organizer.
Curated OER
"Hard" Data from Space
Students use satellite images to analyze development patterns within Baltimore City. They prepare a land cover map for Baltimore indicating the prevalence of impervious surfaces and explore how these patterns affect water pollution.


