Curated OER
My Habitat
Students explore the environment they live in. In this habitats instructional activity, students define habitat and create a web in kidspiration. Students take a walk outside and record what they see and hear and may take pictures as...
Meadows Center for Preventing Educational Risk, University of Texas at Austin
Sight Word Fluency Lists 61 to 70
Every word matters. Increase reading fluency with word recognition practice. Scholars continue to practice reading words in each list until they demonstrate mastery. Readers practice both new and review word lists.
Curated OER
Learning to Write and Send Email
Students generate more expressibe and receptive language by send emails to a friend. They improve their word processing and technology skills by sending and receiving emails. A rubric is included in this lesson plan for assessment purposes.
Curated OER
Pets Galore!
Fourth graders conduct a class survey on the number of pets that the 4th grade owns and they record that data in their math notebooks. They make a bar graph displaying the results using a spreadsheet through Microsoft Excel.
Curated OER
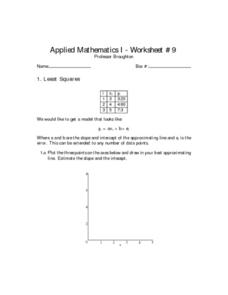
Least Squares
In this least squares worksheet, students solve 6 different problems that include the least squares of numbers. First, they plot 3 points on the axes shown and draw in their best approximating line. Then, students estimate the slope and...
Utah Education Network (UEN)
Linear Relationships: Tables, Equations, and Graphs
Pupils explore the concept of linear relationships. They discuss real-world examples of independent and dependent relationships. In addition, they use tables, graphs, and equations to represent linear relationships. They also use ordered...
Curated OER
M & M Madness
Second graders graph M & M's by color. In this graphing lesson plan, 2nd graders first predict how many of each color they think are in a handful of M & M's. Then they graph the amounts of each color on a computer program....
Curated OER
Young Voters Make A Difference
Students research recent statistics on voting by those 18 to 24. They survey senior students to determine their intent to vote in the next election. Students display the data in charts and graphs. They write the results and share it with...
Curated OER
Graphing Calculator Activity: Multiplying and Dividing Mixed Numbers
In this graphing calculator worksheet, students explore necessary steps to multiply and divide mixed numbers using a graphing calculator. In groups, students measure objects in their classroom and write equations using their collected...
Curated OER
Investing
Young scholars collect data on investments and draw conclusions. In this algebra lesson plan, students analyze exponential graphs as they relate to money. They discuss the cause of an account balance being high or low.
Curated OER
Creation Myths Data Chart
For this creation myth data chart worksheet, students share the titles of 3 why stories they read and think about how they are alike and different. The graphic organizer is used to enable students to collect data and share it easily...
Curated OER
Sampling Rocks
Students examine how to take a sample by looking at rocks in the schoolyard. In this sampling activity, students discuss ways to classify rocks by color, size, and weight. They think about how many rocks would make a good sample of...
Curated OER
Even or Not Even?
In this numbers learning exercise, students analyze 12 different numbers, all of which are multiples of the number 5. They determine which numbers are even and which are odd. Students write the even numbers in the Even column and the odd...
Curated OER
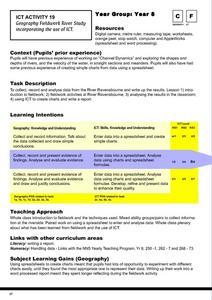
Geography Fieldwork River Study
Eighth graders collect, record, and analyze data from a local river and input the data into the computer. They collect and record the information, discuss the data collected, and enter the data into a spreadsheet and charts to compare...
Curated OER
What Can Scatterplots Tell Us?
Eighth graders use data from surveys conducted with parents, peers and themselves to create computer-generated scatterplots. They make inferences from their scatterplots.
Curated OER
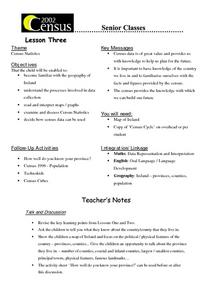
Census Statistics
Twelfth graders become familiar with the geography of Ireland. They explore the processes involved in data collection. Students examine and discuss Census Statistics and read and interpret maps/graphs. They decide how the census data can...
Curated OER
"YIKES! Your Body Up Close" by Mike Janulewicz
Students use a Venn Diagram to analyze data from their class.
University of Georgia
Energy Content of Foods
Why do athletes load up on carbohydrates the evening before a competition? The lesson helps answer this question as it relates the type of food to the amount of energy it contains. After a discussion, scholars perform an experiment...
Curated OER
Scientific Approach to Forest Management
Students use wireless laptop computers to collect, store, communicate, and organize data from the 1999 Jasper Fire area. They collect data in the field and compare it to student-collected data from prior years to develop conclusions...
Curated OER
Statistics with State Names
Students analyze the number of times each letter in the alphabet is used in the names of the states. For this statistics lesson, students create a stem and leaf plot, box and whisker plot and a histogram to analyze their data.
Curated OER
Project Interactive--Stem and Leaf Plotter
In this excellent stem and leaf plotter worksheet, students construct, arrange and write a report of how to interpret the leaves they collect in this data analysis. Students answer 4 detailed questions regarding the data analysis...
Curated OER
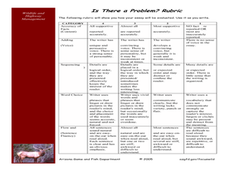
Is There a Problem with Wildlife on our Roads?
Learners create a graph and analyze it to see if the data shows there is a problem with wildlife on the roads. In this wildlife collision lesson students write an essay to support their conclusions.
Curated OER
Global Warming Statistics
Students research real-time and historic temperature data of U.S. and world locations, and analyze the data using mean, median, and mode averages. They graph the data and draw conclusions by analyzing the data. A spreadsheet is used to...
Curated OER
Graphing Favorite Fruit
Third graders take poll and sort data, enter the data to create a spreadsheet and create bar and pie graphs.


