Interactive Mathematics
Interactive Mathematics: Curve Sketching
Sketches of functions are drawn by determing important points: x- and y-intercepts, local maxima and minima, and point of inflection. The general shapes of specific functions are illustrated to help identify characteristics of each type...
Wolfram Research
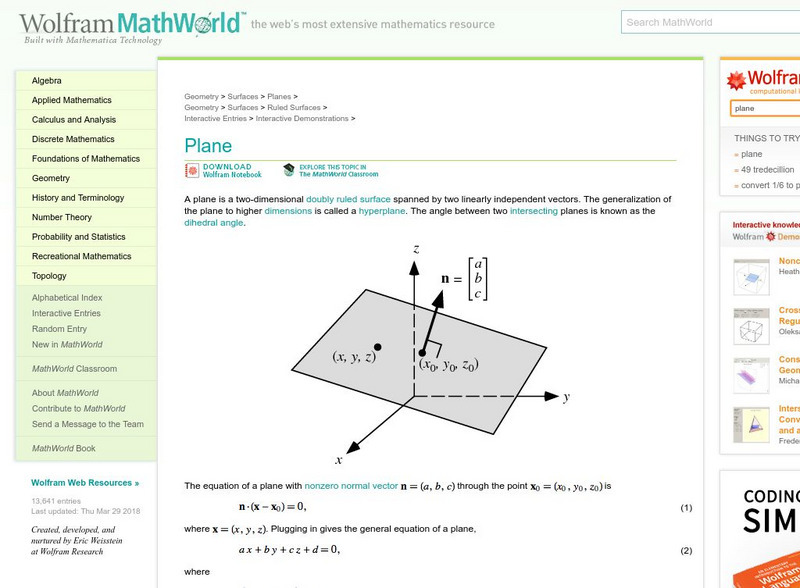
Wolfram Math World: Plane
This site defines a plane in terms of geometric surfaces. Content includes formulas for a plane using the normal vector, how to find the x, y, and z intercepts of a plane, distance from the origin, point plane distance formula, dihedral...
Varsity Tutors
Varsity Tutors: Hotmath: Practice Problems: Graphing Linear Equations
Twenty-one problems present a variety of practice graphing linear equations. They are given with each step to the solution cleverly revealed one at a time. You can work each step of the problem then click the "View Solution" button to...
Other
Desmos: Linear Bundle
A collection of activities where students investigate linear equations. Activities involve an exploration of the lines in a polygraph and the vocabulary needed to describe them accurately; the slope in graphs; lines in different...
Texas Education Agency
Texas Gateway: Solving Quadratic Equations Using Graphs
Given a quadratic equation, the student will use graphical methods to solve the equation.
Texas A&M University
Wtamu Virtual Math Lab: College Algebra: Domain, Range, Vertical Line Test
A detailed tutorial on functions covering the following topics: finding the domain and range of a function, using the vertical line test, determining whether a function is even, odd, or neither, and applying the greatest integer function...
Texas Education Agency
Texas Gateway: Analyzing Graphs of Quadratic Functions
Given the graph of a situation represented by a quadratic function, the student will analyze the graph and draw conclusions.
Texas Instruments
Texas Instruments: The Standard Form of a Quadratic Equation
In this activity, students explore the standard form of a quadratic equation, y = ax 2 + bx + c. They explore how the x-intercepts (zeros), y-intercept, and vertex are related to the graph of the standard form of a quadratic function.
Concord Consortium
Seeing Math: Function Analyzer
The Function Analyzer allows learners to see the connections among three representations of a function: symbolic, area, and graphic. In addition, by allowing learners to change the value of four elements of a function - the coefficient...
CK-12 Foundation
Ck 12: Algebra: Quadratic Functions and Their Graphs
[Free Registration/Login may be required to access all resource tools.] This lesson covers how to find the x-intercepts, vertex, axis of symmetry, and y-intercept of a parabola.
Texas A&M University
Wtamu Virtual Math Lab: Beginning Algebra: Graphing Linear Inequalities
A tutorial on how to graph a linear inequality in two variables. The tutorial offers step-by-step instruction and examples of how to graph linear inequalities.
Northeast Parallel Architectures Center, Syracuse University
Npac Reu Program: Graphing With Coordinates in the Plane
This site from the Northeast Parallel Architectures Center, Syracuse University provides a good five-part basic graphing instructor. Covers all the basics clearly. It is divided into links for easier navigation.
Windstream
Ojk's Precalculus Study Page: Functions of Two Variables
An introduction to functions with two variables, including several examples relating to linear programming. The tutorial includes graphical examples of the functions and also review questions located at the bottom of the page.
ClassFlow
Class Flow: Straight Lines
[Free Registration/Login Required] Students explore straight lines, graphing lines and applying the formula for graphing linear equations.
Other popular searches
- Finding X and Y Intercepts
- Graph Using X and Y Intercepts
- Finding the X and Y Intercepts
- X Y Intercepts Graphing
- Graph X and Y Intercepts
- Graphing X and Y Intercepts
- Y X Intercepts

